
 Yahoo Finance
 Is Altura Energy Inc.'s (CVE:ATU) CEO Overpaid Relative To Its Peers?

In 2015 David Burghardt was appointed CEO of Altura Energy Inc. (CVE:ATU). First, this article will compare CEO compensation with compensation at similar sized companies. Then we'll look at a snap shot of the business growth. And finally we will reflect on how common stockholders have fared in the last few years, as a secondary measure of performance. This process should give us an idea about how appropriately the CEO is paid.
Check out our latest analysis for Altura Energy
How Does David Burghardt's Compensation Compare With Similar Sized Companies?
At the time of writing, our data says that Altura Energy Inc. has a market cap of CA$32m, and reported total annual CEO compensation of CA$273k for the year to December 2018. We think total compensation is more important but we note that the CEO salary is lower, at CA$183k. We examined a group of similar sized companies, with market capitalizations of below CA$264m. The median CEO total compensation in that group is CA$180k.
As you can see, David Burghardt is paid more than the median CEO pay at companies of a similar size, in the same market. However, this does not necessarily mean Altura Energy Inc. is paying too much. We can get a better idea of how generous the pay is by looking at the performance of the underlying business.
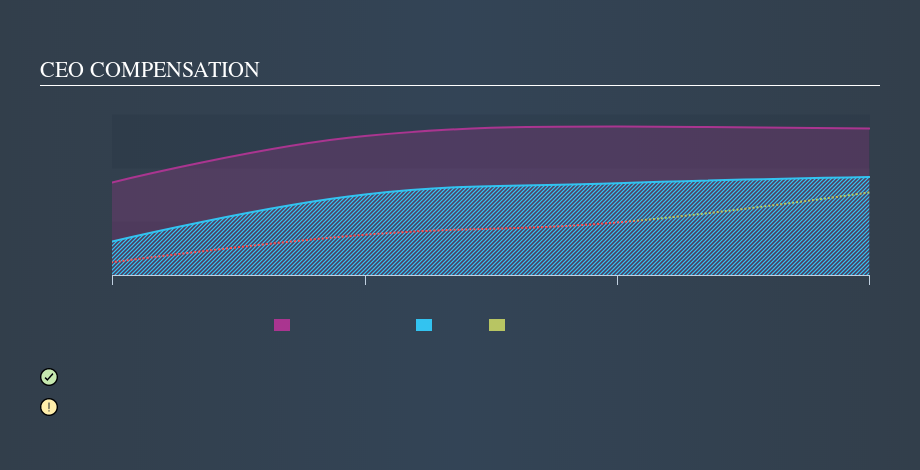
You can see a visual representation of the CEO compensation at Altura Energy, below.
Is Altura Energy Inc. Growing?
Over the last three years Altura Energy Inc. has grown its earnings per share (EPS) by an average of 117% per year (using a line of best fit). It achieved revenue growth of 19% over the last year.
Overall this is a positive result for shareholders, showing that the company has improved in recent years. This sort of respectable year-on-year revenue growth is often seen at a healthy, growing business. Shareholders might be interested in this free visualization of analyst forecasts.
Has Altura Energy Inc. Been A Good Investment?
Altura Energy Inc. has generated a total shareholder return of 3.6% over three years, so most shareholders wouldn't be too disappointed. But they probably wouldn't be so happy as to think the CEO should be paid more than is normal, for companies around this size.
In Summary...
We compared the total CEO remuneration paid by Altura Energy Inc., and compared it to remuneration at a group of similar sized companies. Our data suggests that it pays above the median CEO pay within that group.
However, the earnings per share growth over three years is certainly impressive. We also note that, over the same time frame, shareholder returns haven't been bad. So, considering the EPS growth we do not wish to criticize the level of CEO compensation, though we'd recommend further research on management. If you think CEO compensation levels are interesting you will probably really like this free visualization of insider trading at Altura Energy.
If you want to buy a stock that is better than Altura Energy, this free list of high return, low debt companies is a great place to look.
We aim to bring you long-term focused research analysis driven by fundamental data. Note that our analysis may not factor in the latest price-sensitive company announcements or qualitative material.
If you spot an error that warrants correction, please contact the editor at editorial-team@simplywallst.com. This article by Simply Wall St is general in nature. It does not constitute a recommendation to buy or sell any stock, and does not take account of your objectives, or your financial situation. Simply Wall St has no position in the stocks mentioned. Thank you for reading.
