
 Yahoo Finance
 Alt Coins Price Forecast February 16, 2018, Technical Analysis
Bitcoin Gold
Bitcoin Gold traders did very little during the trading session, essentially ending the day down 0.75% or so. The $150 level above looms large as resistance, as it was significant support previously, and volume is not strong enough for me to feel comfortable buying at this point. I think if we can break above the $150 level with a bit of volume, then we could probably go towards the $200 level after that. Otherwise, we will probably roll back over looking for buyers underneath to pick the market up.
BTG/USD DASH USD and XMR USD Video 16.02.18

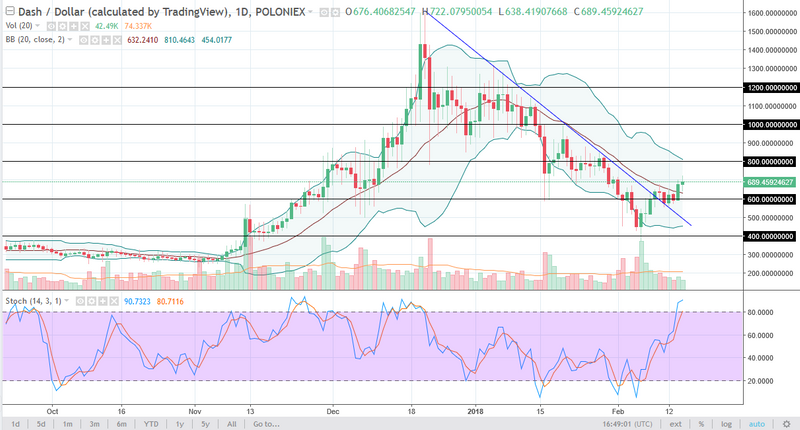
DASH/USD
DASH traders went back and forth during the session on Thursday but found the 20 SMA on the Bollinger Bands indicator to be supportive enough to let the market. The $700 level was the scene of support previously, and it should be resistance now. I think it is a hard fight to the $800 level above, and I think that the occasional short-term pullback is likely. However, you can see that on the chart I have a downtrend line that has been broken, so I do believe that DASH is going to start picking up value again. $800 will loom large though, and probably take several attempts to finally break above. At this point, $600 looks to be very supportive.
XMR/USD
Monero markets did very little during the day, but the one thing that they did manage is to rally after a slight pullback. That’s a good sign, as we are forming a hammer just below the $280 level, an area that has been support in the past. However, I see a zone of resistance extending to the $325 level, so although I am bullish of this market, I think that it is going to be difficult to get to that level. I think we’re going to see more of a grind than anything else, so being patient will be crucial. Pullbacks to the $250 level should be reasonably supported.
Buy & Sell Cryptocurrency Instantly

This article was originally posted on FX Empire
