
 Yahoo Finance
 Alt Coins Forecast for the week of March 5, 2018, Technical Analysis
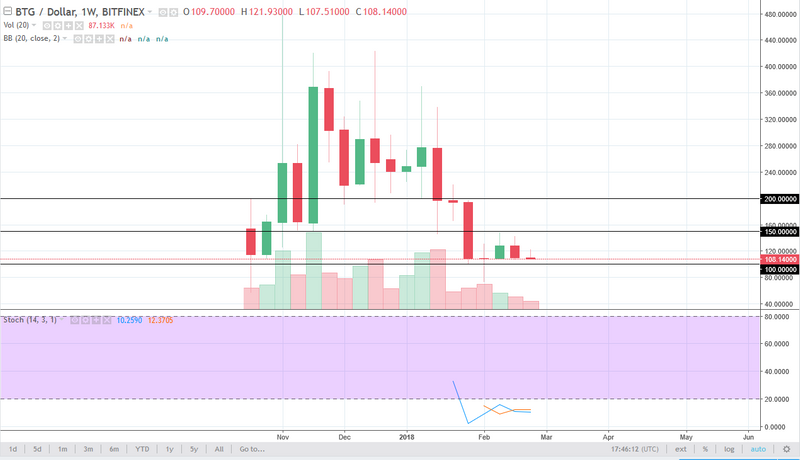
BTG/USD
Bitcoin Gold initially tried to rally during the week but turned around at the $120 level to roll significantly and form a bit of a shooting star. The shooting star sits right at the bottom of the market, which is a very negative sign. However, a couple of weeks ago we had a hammer, so I think that we are getting ready to see is a lot of sideways action, perhaps with a slightly negative bias. I would not expect a big move at this point, but if we were to break down below the bottom of the hammer from a couple of weeks ago, extensively the $70 level, Bitcoin Gold could fall drastically, reaching $50 initially, and then who knows from there.
BTG/USD DASH USD and XMR USD Video 05.03.18
DASH/USD
The DASH market has rally during the week, but gave back most of the gains, in order to form a shooting star. This tells me that the market is likely to roll over and go looking towards the uptrend line on the weekly chart, meaning that we will probably reach towards the $420 region or so. If we broke above the top of the candle for the week, we will probably go looking at the $750 level next as well. Expect volatility, but I think the next week or so is going to determine where we go next.

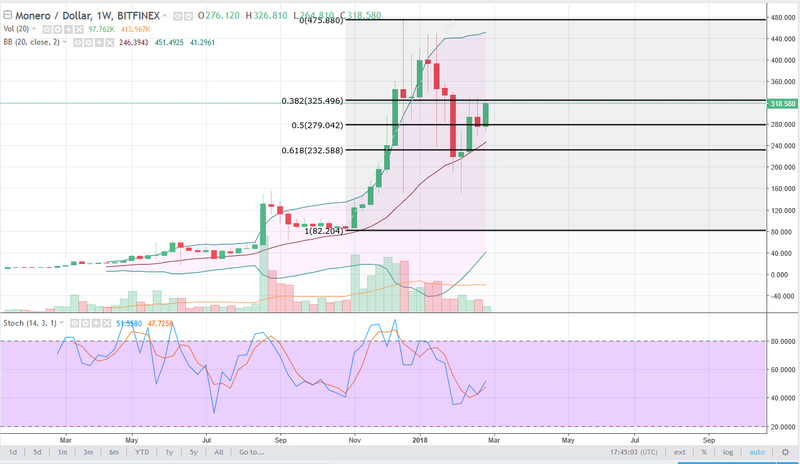
XMR/USD
Monero markets initially fell during the week, but then exploded to the upside, to test a major resistance barrier in the area of $325. We are testing the top of a shooting star from the previous week, and that of course is a very bullish sign. I think that if we can break above the highs from the last couple of weeks, this market will break out to the upside and go looking towards the $400 level. Clearly, out of the 3 alt coins that we follow, Monero seems to be the most bullish looking market.
Buy & Sell Cryptocurrency Instantly
This article was originally posted on FX Empire
