
 Yahoo Finance
 Allison (ALSN) Beats on Q1 Earnings, Upgrades 2023 Forecast
Allison Transmission Holdings ALSN posted first-quarter 2023 earnings of $1.85 a share, which rose 42% year over year and topped the Zacks Consensus Estimate of $1.52 owing to higher-than-anticipated sales from North America On-Highway, North America Off-Highway and Service Parts, Support Equipment & Other end markets. Quarterly revenues of $741 million grew 9% from the year-ago period and crossed the consensus mark of $715 million.
Allison currently carries a Zacks Rank #2 (Buy). You can see the complete list of today’s Zacks #1 Rank (Strong Buy) stocks here.
Allison Transmission Holdings, Inc. Price, Consensus and EPS Surprise
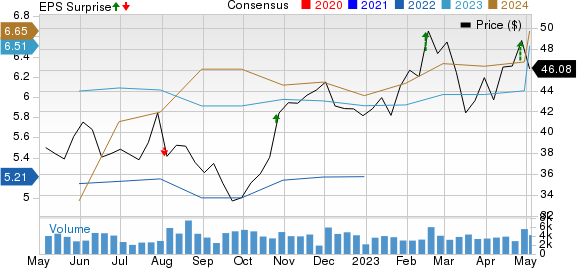
Allison Transmission Holdings, Inc. price-consensus-eps-surprise-chart | Allison Transmission Holdings, Inc. Quote
Segmental Performance
Allison segregates revenues in terms of end markets served, which are as follows:
In the reported quarter, net sales in the North America On-Highway end market rose 9% year over year to $376 million amid robust customer demand for medium-duty and Class 8 vocational trucks along with price increases in certain products. Also, the metric surpassed the Zacks Consensus Estimate of $351 million.
Net sales in the North America Off-Highway end market jumped 33% to $24 million from the year-ago period and exceeded the Zacks Consensus Estimate of $21.34 million.
In the reported quarter, net sales in the Defense end market declined 23% year over year to $27 million and lagged the consensus estimate of $37.23 million.
The Outside North America On-Highway end market’s net sales inched down 1% year over year to $108 million in the quarter and lagged the consensus mark of $123 million.
Net sales in the Outside North America Off-Highway end market contracted 23% year over year to $23 million and lagged the consensus mark of $31.43 million.
Net sales in the Service Parts, Support Equipment & Other end markets grew 32% year over year to $183 million in the quarter, owing to higher prices and solid demand for global service parts and support equipment and aluminum die-cast components. Moreover, the figure crossed the consensus mark of $147 million.
Financial Position
Allison saw a gross profit of $361 million, a 13% increase from $320 million for the same period in 2022, mainly driven by higher net sales and price increases on certain products.
Adjusted EBITDA in the quarter came in at $276 million, an increase of 13% from $244 million a year ago. The growth was led by higher gross profit.
Selling, general and administrative expenses in the quarter increased to $87 million from $75 million for the same period in 2022, driven by higher commercial activity expenses. Engineering – research and development expenses were $44 million compared with $43 million recorded in the corresponding quarter of 2022.
Allison had cash and cash equivalents of $344 million on Mar 31, 2023, up from $232 million as of Dec 31, 2022. Long-term debt was $2,500 million compared with $2,501 million as of Dec 31, 2022.
Net cash provided by operating activities increased to $193 million from $162 million in the same period in 2022. Adjusted free cash flow in the reported quarter was $169 million, an increase from $142 million a year ago.
During the first quarter, the company hiked its quarterly dividend by 10% to 23 cents/share and repurchased 1% of outstanding shares.
2023 Outlook Raised
Allison’s full-year 2023 net sales are estimated in the band of $2.9-$3 billion. Net income is expected in the band of $550-$600 million. Adjusted EBITDA is estimated within $1.01-$1.09 billion. Adjusted free cash flow is estimated within $510-$560 million. Its expected net cash provided by operating activities is between $635 and $695 million. Capex is expected in the band of $125-$135 million.
Peer Releases
Autoliv ALV reported first-quarter 2023 adjusted earnings of 90 cents per share, beating the Zacks Consensus Estimate of 87 cents. Higher-than-expected revenues from the Airbags and Associated Products segment led to the outperformance. The bottom line also shot up 99% on a year-over-year basis. The company reported net sales of $2,493 million in the quarter, which topped the Zacks Consensus Estimate of $2,283 million and soared 17% year over year. Organic sales rose 21% year over year and breezed past the consensus mark of 6.27%.
Autoliv had cash and cash equivalents of $713 million as of Mar 31, 2023, down 24% year over year. Long-term debt totaled $1601 million, increasing from $1,054 million as of Dec 31, 2022.The company forecasts full-year 2023 organic sales growth of around 15%.
Lear Corp. LEA reported first-quarter 2023 adjusted earnings of $2.78 per share, which surged from $1.80 recorded in the year-ago quarter. The bottom line also surpassed the Zacks Consensus Estimate of $2.55 per share. Higher-than-expected contribution from the Seating segment led to the outperformance. In the reported quarter, revenues increased 12% year over year to $5,845.5 million. The top line also beat the Zacks Consensus Estimate of $5,505 million.
The company had $898.5 million in cash and cash equivalents at the quarter’s end versus $1,114.9 million recorded as of Dec 31, 2022. Lear had long-term debt of $2,591.6 million at the quarter end compared with a debt of $2,591.2 million as of 2022-end.
Oshkosh Corp. OSK reported first-quarter 2023 adjusted earnings of $1.59 per share, beating the Zacks Consensus Estimate of $1. The outperformance can be largely attributed to higher-than-expected sales and profits from the Access segment. The bottom line also rocketed 488% from 27 cents recorded in the year-ago period. In the quarter under review, consolidated net sales climbed 16.6% year over year to $2,268 million. The top line surpassed the Zacks Consensus Estimate of $2,091 million.
Oshkosh had cash and cash equivalents of $538.7 million as of Mar 31, 2023. The company recorded a long-term debt of $595.2 million, essentially flat from the 2022-end levels. Oshkosh declared a quarterly cash dividend of 41 cents per share. The dividend will be paid out on May 30 to shareholders on record as of May 15, 2023.
Want the latest recommendations from Zacks Investment Research? Today, you can download 7 Best Stocks for the Next 30 Days. Click to get this free report
Autoliv, Inc. (ALV) : Free Stock Analysis Report
Lear Corporation (LEA) : Free Stock Analysis Report
Allison Transmission Holdings, Inc. (ALSN) : Free Stock Analysis Report
Oshkosh Corporation (OSK) : Free Stock Analysis Report
