
 Yahoo Finance
 Will Algonquin Power & Utilities Corp (TSE:AQN) Continue To Underperform Its Industry?

The content of this article will benefit those of you who are starting to educate yourself about investing in the stock market and want a simplistic look at the return on Algonquin Power & Utilities Corp (TSE:AQN) stock.
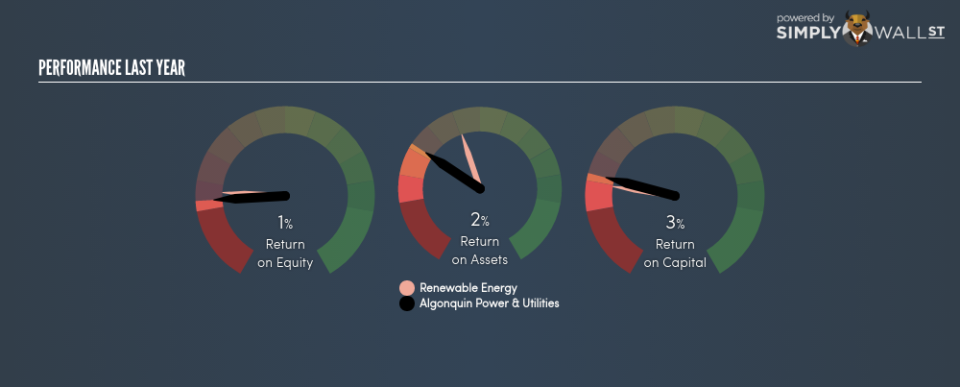
Algonquin Power & Utilities Corp (TSE:AQN) generated a below-average return on equity of 1.09% in the past 12 months, while its industry returned 2.08%. AQN’s results could indicate a relatively inefficient operation to its peers, and while this may be the case, it is important to understand what ROE is made up of and how it should be interpreted. Knowing these components could change your view on AQN’s performance. Today I will look at how components such as financial leverage can influence ROE which may impact the sustainability of AQN’s returns. See our latest analysis for Algonquin Power & Utilities
What you must know about ROE
Firstly, Return on Equity, or ROE, is simply the percentage of last years’ earning against the book value of shareholders’ equity. For example, if the company invests CA$1 in the form of equity, it will generate CA$0.011 in earnings from this. While a higher ROE is preferred in most cases, there are several other factors we should consider before drawing any conclusions.
Return on Equity = Net Profit ÷ Shareholders Equity
Returns are usually compared to costs to measure the efficiency of capital. Algonquin Power & Utilities’s cost of equity is 8.47%. This means Algonquin Power & Utilities’s returns actually do not cover its own cost of equity, with a discrepancy of -7.38%. This isn’t sustainable as it implies, very simply, that the company pays more for its capital than what it generates in return. ROE can be dissected into three distinct ratios: net profit margin, asset turnover, and financial leverage. This is called the Dupont Formula:
Dupont Formula
ROE = profit margin × asset turnover × financial leverage
ROE = (annual net profit ÷ sales) × (sales ÷ assets) × (assets ÷ shareholders’ equity)
ROE = annual net profit ÷ shareholders’ equity
Essentially, profit margin shows how much money the company makes after paying for all its expenses. Asset turnover reveals how much revenue can be generated from Algonquin Power & Utilities’s asset base. And finally, financial leverage is simply how much of assets are funded by equity, which exhibits how sustainable the company’s capital structure is. Since financial leverage can artificially inflate ROE, we need to look at how much debt Algonquin Power & Utilities currently has. At 119.68%, Algonquin Power & Utilities’s debt-to-equity ratio appears balanced and indicates its ROE is generated from its capacity to increase profit without a large debt burden.

Next Steps:
ROE is one of many ratios which meaningfully dissects financial statements, which illustrates the quality of a company. Algonquin Power & Utilities’s ROE is underwhelming relative to the industry average, and its returns were also not strong enough to cover its own cost of equity. Although, its appropriate level of leverage means investors can be more confident in the sustainability of Algonquin Power & Utilities’s return with a possible increase should the company decide to increase its debt levels. Although ROE can be a useful metric, it is only a small part of diligent research.
For Algonquin Power & Utilities, there are three essential factors you should further examine:
Financial Health: Does it have a healthy balance sheet? Take a look at our free balance sheet analysis with six simple checks on key factors like leverage and risk.
Valuation: What is Algonquin Power & Utilities worth today? Is the stock undervalued, even when its growth outlook is factored into its intrinsic value? The intrinsic value infographic in our free research report helps visualize whether Algonquin Power & Utilities is currently mispriced by the market.
Other High-Growth Alternatives : Are there other high-growth stocks you could be holding instead of Algonquin Power & Utilities? Explore our interactive list of stocks with large growth potential to get an idea of what else is out there you may be missing!
To help readers see pass the short term volatility of the financial market, we aim to bring you a long-term focused research analysis purely driven by fundamental data. Note that our analysis does not factor in the latest price sensitive company announcements.
The author is an independent contributor and at the time of publication had no position in the stocks mentioned.
