
 Yahoo Finance
 Is Alcoa Corporation (NYSE:AA) As Strong As Its Balance Sheet Indicates?

Want to participate in a short research study? Help shape the future of investing tools and you could win a $250 gift card!
Small-caps and large-caps are wildly popular among investors, however, mid-cap stocks, such as Alcoa Corporation (NYSE:AA), with a market capitalization of US$4.0b, rarely draw their attention from the investing community. However, generally ignored mid-caps have historically delivered better risk adjusted returns than both of those groups. AA’s financial liquidity and debt position will be analysed in this article, to get an idea of whether the company can fund opportunities for strategic growth and maintain strength through economic downturns. Note that this commentary is very high-level and solely focused on financial health, so I suggest you dig deeper yourself into AA here.
Check out our latest analysis for Alcoa
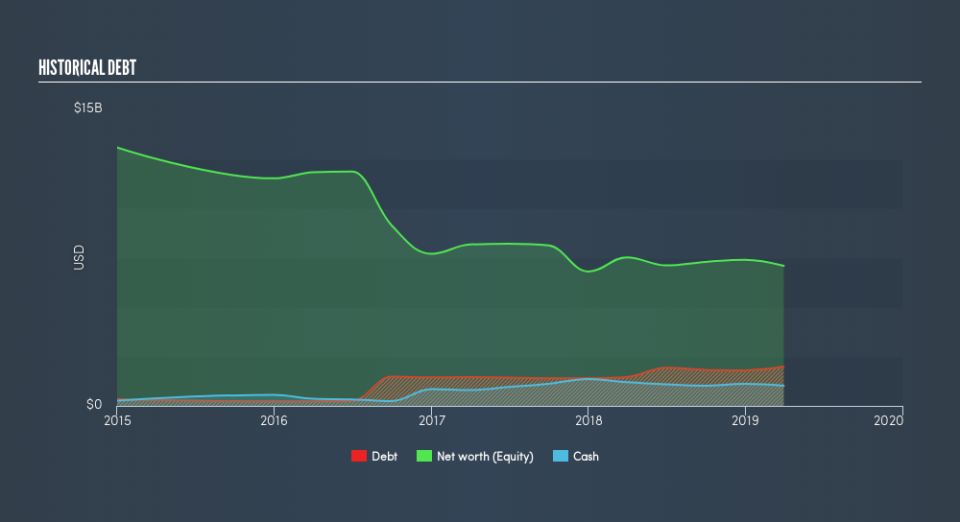
Does AA Produce Much Cash Relative To Its Debt?
Over the past year, AA has ramped up its debt from US$1.5b to US$2.0b , which includes long-term debt. With this growth in debt, the current cash and short-term investment levels stands at US$1.0b to keep the business going. On top of this, AA has produced US$561m in operating cash flow during the same period of time, resulting in an operating cash to total debt ratio of 28%, indicating that AA’s operating cash is sufficient to cover its debt.
Can AA pay its short-term liabilities?
Looking at AA’s US$2.8b in current liabilities, it appears that the company has been able to meet these commitments with a current assets level of US$4.1b, leading to a 1.47x current account ratio. The current ratio is calculated by dividing current assets by current liabilities. Usually, for Metals and Mining companies, this is a suitable ratio since there is a bit of a cash buffer without leaving too much capital in a low-return environment.
Does AA face the risk of succumbing to its debt-load?
With a debt-to-equity ratio of 25%, AA's debt level may be seen as prudent. AA is not taking on too much debt commitment, which can be restrictive and risky for equity-holders. Risk around debt is very low for AA, and the company also has the ability and headroom to increase debt if needed going forward.
Next Steps:
AA’s debt level is appropriate for a company its size, and it is also able to generate sufficient cash flow coverage, meaning it has been able to put its debt in good use. Furthermore, the company exhibits proper management of current assets and upcoming liabilities. This is only a rough assessment of financial health, and I'm sure AA has company-specific issues impacting its capital structure decisions. I suggest you continue to research Alcoa to get a more holistic view of the stock by looking at:
Future Outlook: What are well-informed industry analysts predicting for AA’s future growth? Take a look at our free research report of analyst consensus for AA’s outlook.
Valuation: What is AA worth today? Is the stock undervalued, even when its growth outlook is factored into its intrinsic value? The intrinsic value infographic in our free research report helps visualize whether AA is currently mispriced by the market.
Other High-Performing Stocks: Are there other stocks that provide better prospects with proven track records? Explore our free list of these great stocks here.
We aim to bring you long-term focused research analysis driven by fundamental data. Note that our analysis may not factor in the latest price-sensitive company announcements or qualitative material.
If you spot an error that warrants correction, please contact the editor at editorial-team@simplywallst.com. This article by Simply Wall St is general in nature. It does not constitute a recommendation to buy or sell any stock, and does not take account of your objectives, or your financial situation. Simply Wall St has no position in the stocks mentioned. Thank you for reading.
