
 Yahoo Finance
 Alamos Gold (TSE:AGI) shareholders are still up 144% over 3 years despite pulling back 3.6% in the past week
It might seem bad, but the worst that can happen when you buy a stock (without leverage) is that its share price goes to zero. But when you pick a company that is really flourishing, you can make more than 100%. For example, the Alamos Gold Inc. (TSE:AGI) share price has soared 138% in the last three years. That sort of return is as solid as granite. On top of that, the share price is up 12% in about a quarter. But this could be related to the strong market, which is up 5.7% in the last three months.
In light of the stock dropping 3.6% in the past week, we want to investigate the longer term story, and see if fundamentals have been the driver of the company's positive three-year return.
Check out our latest analysis for Alamos Gold
While markets are a powerful pricing mechanism, share prices reflect investor sentiment, not just underlying business performance. One way to examine how market sentiment has changed over time is to look at the interaction between a company's share price and its earnings per share (EPS).
Alamos Gold became profitable within the last three years. That kind of transition can be an inflection point that justifies a strong share price gain, just as we have seen here.
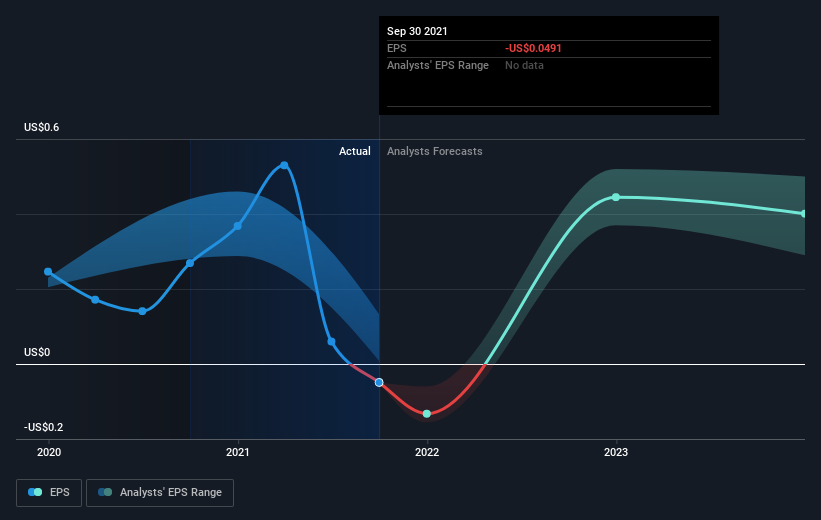
The company's earnings per share (over time) is depicted in the image below (click to see the exact numbers).
It is of course excellent to see how Alamos Gold has grown profits over the years, but the future is more important for shareholders. You can see how its balance sheet has strengthened (or weakened) over time in this free interactive graphic.
What About Dividends?
It is important to consider the total shareholder return, as well as the share price return, for any given stock. Whereas the share price return only reflects the change in the share price, the TSR includes the value of dividends (assuming they were reinvested) and the benefit of any discounted capital raising or spin-off. So for companies that pay a generous dividend, the TSR is often a lot higher than the share price return. We note that for Alamos Gold the TSR over the last 3 years was 144%, which is better than the share price return mentioned above. The dividends paid by the company have thusly boosted the total shareholder return.
A Different Perspective
While the broader market gained around 31% in the last year, Alamos Gold shareholders lost 6.8% (even including dividends). However, keep in mind that even the best stocks will sometimes underperform the market over a twelve month period. On the bright side, long term shareholders have made money, with a gain of 6% per year over half a decade. It could be that the recent sell-off is an opportunity, so it may be worth checking the fundamental data for signs of a long term growth trend. Before spending more time on Alamos Gold it might be wise to click here to see if insiders have been buying or selling shares.
Of course, you might find a fantastic investment by looking elsewhere. So take a peek at this free list of companies we expect will grow earnings.
Please note, the market returns quoted in this article reflect the market weighted average returns of stocks that currently trade on CA exchanges.
This article by Simply Wall St is general in nature. We provide commentary based on historical data and analyst forecasts only using an unbiased methodology and our articles are not intended to be financial advice. It does not constitute a recommendation to buy or sell any stock, and does not take account of your objectives, or your financial situation. We aim to bring you long-term focused analysis driven by fundamental data. Note that our analysis may not factor in the latest price-sensitive company announcements or qualitative material. Simply Wall St has no position in any stocks mentioned.
Have feedback on this article? Concerned about the content? Get in touch with us directly. Alternatively, email editorial-team (at) simplywallst.com.
