
 Yahoo Finance
 Alamo Group's (NYSE:ALG) five-year earnings growth trails the 5.7% YoY shareholder returns
It hasn't been the best quarter for Alamo Group Inc. (NYSE:ALG) shareholders, since the share price has fallen 21% in that time. But the silver lining is the stock is up over five years. Unfortunately its return of 29% is below the market return of 64%.
Since the stock has added US$64m to its market cap in the past week alone, let's see if underlying performance has been driving long-term returns.
View our latest analysis for Alamo Group
To quote Buffett, 'Ships will sail around the world but the Flat Earth Society will flourish. There will continue to be wide discrepancies between price and value in the marketplace...' One way to examine how market sentiment has changed over time is to look at the interaction between a company's share price and its earnings per share (EPS).
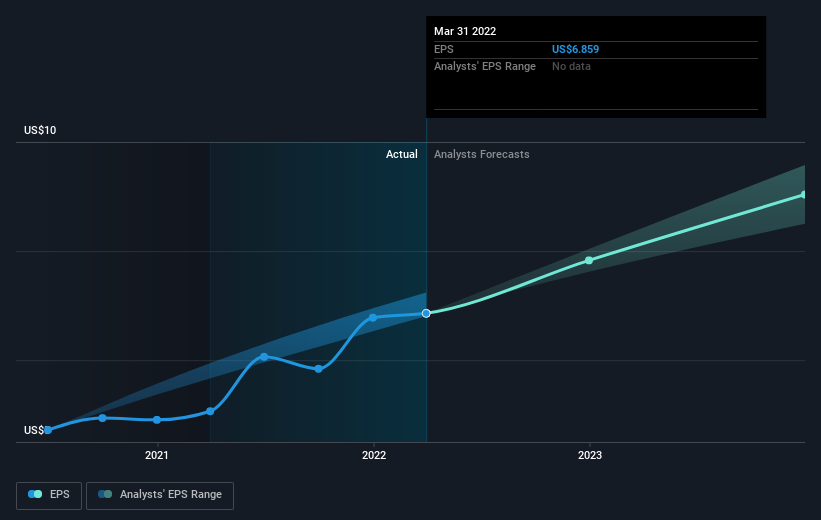
Over half a decade, Alamo Group managed to grow its earnings per share at 12% a year. This EPS growth is higher than the 5% average annual increase in the share price. Therefore, it seems the market has become relatively pessimistic about the company.
You can see below how EPS has changed over time (discover the exact values by clicking on the image).
We like that insiders have been buying shares in the last twelve months. Having said that, most people consider earnings and revenue growth trends to be a more meaningful guide to the business. Before buying or selling a stock, we always recommend a close examination of historic growth trends, available here..
What About Dividends?
When looking at investment returns, it is important to consider the difference between total shareholder return (TSR) and share price return. The TSR incorporates the value of any spin-offs or discounted capital raisings, along with any dividends, based on the assumption that the dividends are reinvested. It's fair to say that the TSR gives a more complete picture for stocks that pay a dividend. As it happens, Alamo Group's TSR for the last 5 years was 32%, which exceeds the share price return mentioned earlier. And there's no prize for guessing that the dividend payments largely explain the divergence!
A Different Perspective
We regret to report that Alamo Group shareholders are down 22% for the year (even including dividends). Unfortunately, that's worse than the broader market decline of 19%. Having said that, it's inevitable that some stocks will be oversold in a falling market. The key is to keep your eyes on the fundamental developments. On the bright side, long term shareholders have made money, with a gain of 6% per year over half a decade. If the fundamental data continues to indicate long term sustainable growth, the current sell-off could be an opportunity worth considering. It's always interesting to track share price performance over the longer term. But to understand Alamo Group better, we need to consider many other factors. Even so, be aware that Alamo Group is showing 1 warning sign in our investment analysis , you should know about...
Alamo Group is not the only stock insiders are buying. So take a peek at this free list of growing companies with insider buying.
Please note, the market returns quoted in this article reflect the market weighted average returns of stocks that currently trade on US exchanges.
Have feedback on this article? Concerned about the content? Get in touch with us directly. Alternatively, email editorial-team (at) simplywallst.com.
This article by Simply Wall St is general in nature. We provide commentary based on historical data and analyst forecasts only using an unbiased methodology and our articles are not intended to be financial advice. It does not constitute a recommendation to buy or sell any stock, and does not take account of your objectives, or your financial situation. We aim to bring you long-term focused analysis driven by fundamental data. Note that our analysis may not factor in the latest price-sensitive company announcements or qualitative material. Simply Wall St has no position in any stocks mentioned.
