
 Yahoo Finance
 Akamai Technologies' (NASDAQ:AKAM) earnings growth rate lags the 12% CAGR delivered to shareholders
Akamai Technologies, Inc. (NASDAQ:AKAM) shareholders have seen the share price descend 11% over the month. But that doesn't change the fact that the returns over the last five years have been pleasing. After all, the share price is up a market-beating 75% in that time. While the long term returns are impressive, we do have some sympathy for those who bought more recently, given the 23% drop, in the last year.
While this past week has detracted from the company's five-year return, let's look at the recent trends of the underlying business and see if the gains have been in alignment.
Check out our latest analysis for Akamai Technologies
While the efficient markets hypothesis continues to be taught by some, it has been proven that markets are over-reactive dynamic systems, and investors are not always rational. By comparing earnings per share (EPS) and share price changes over time, we can get a feel for how investor attitudes to a company have morphed over time.
During five years of share price growth, Akamai Technologies achieved compound earnings per share (EPS) growth of 16% per year. This EPS growth is higher than the 12% average annual increase in the share price. So it seems the market isn't so enthusiastic about the stock these days.
The graphic below depicts how EPS has changed over time (unveil the exact values by clicking on the image).
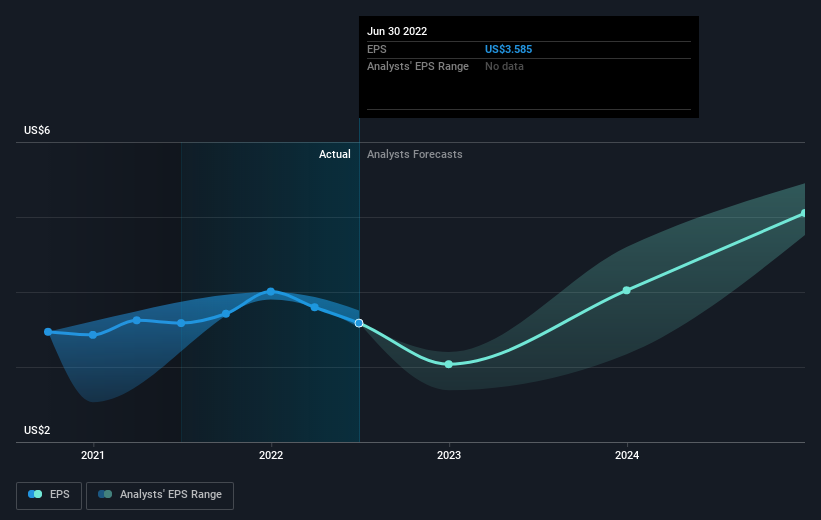
Dive deeper into Akamai Technologies' key metrics by checking this interactive graph of Akamai Technologies's earnings, revenue and cash flow.
A Different Perspective
While the broader market lost about 19% in the twelve months, Akamai Technologies shareholders did even worse, losing 23%. Having said that, it's inevitable that some stocks will be oversold in a falling market. The key is to keep your eyes on the fundamental developments. Longer term investors wouldn't be so upset, since they would have made 12%, each year, over five years. If the fundamental data continues to indicate long term sustainable growth, the current sell-off could be an opportunity worth considering. While it is well worth considering the different impacts that market conditions can have on the share price, there are other factors that are even more important. Even so, be aware that Akamai Technologies is showing 1 warning sign in our investment analysis , you should know about...
We will like Akamai Technologies better if we see some big insider buys. While we wait, check out this free list of growing companies with considerable, recent, insider buying.
Please note, the market returns quoted in this article reflect the market weighted average returns of stocks that currently trade on US exchanges.
Have feedback on this article? Concerned about the content? Get in touch with us directly. Alternatively, email editorial-team (at) simplywallst.com.
This article by Simply Wall St is general in nature. We provide commentary based on historical data and analyst forecasts only using an unbiased methodology and our articles are not intended to be financial advice. It does not constitute a recommendation to buy or sell any stock, and does not take account of your objectives, or your financial situation. We aim to bring you long-term focused analysis driven by fundamental data. Note that our analysis may not factor in the latest price-sensitive company announcements or qualitative material. Simply Wall St has no position in any stocks mentioned.
Join A Paid User Research Session
You’ll receive a US$30 Amazon Gift card for 1 hour of your time while helping us build better investing tools for the individual investors like yourself. Sign up here

