
 Yahoo Finance
 Adacel Technologies (ASX:ADA) shareholders have endured a 52% loss from investing in the stock five years ago
Statistically speaking, long term investing is a profitable endeavour. But no-one is immune from buying too high. For example the Adacel Technologies Limited (ASX:ADA) share price dropped 62% over five years. That's an unpleasant experience for long term holders. The falls have accelerated recently, with the share price down 20% in the last three months.
Now let's have a look at the company's fundamentals, and see if the long term shareholder return has matched the performance of the underlying business.
Check out our latest analysis for Adacel Technologies
To paraphrase Benjamin Graham: Over the short term the market is a voting machine, but over the long term it's a weighing machine. By comparing earnings per share (EPS) and share price changes over time, we can get a feel for how investor attitudes to a company have morphed over time.
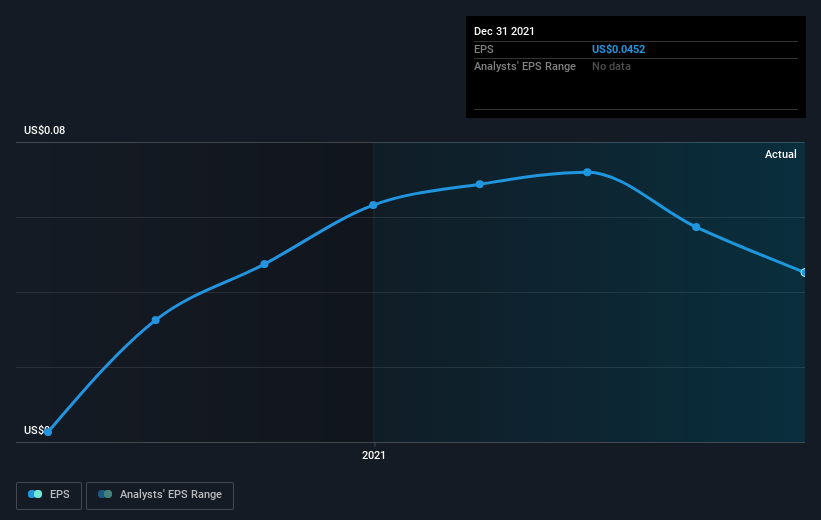
Looking back five years, both Adacel Technologies' share price and EPS declined; the latter at a rate of 7.7% per year. This reduction in EPS is less than the 18% annual reduction in the share price. This implies that the market was previously too optimistic about the stock.
You can see below how EPS has changed over time (discover the exact values by clicking on the image).
It might be well worthwhile taking a look at our free report on Adacel Technologies' earnings, revenue and cash flow.
What About Dividends?
When looking at investment returns, it is important to consider the difference between total shareholder return (TSR) and share price return. The TSR incorporates the value of any spin-offs or discounted capital raisings, along with any dividends, based on the assumption that the dividends are reinvested. It's fair to say that the TSR gives a more complete picture for stocks that pay a dividend. We note that for Adacel Technologies the TSR over the last 5 years was -52%, which is better than the share price return mentioned above. This is largely a result of its dividend payments!
A Different Perspective
It's nice to see that Adacel Technologies shareholders have received a total shareholder return of 16% over the last year. Of course, that includes the dividend. There's no doubt those recent returns are much better than the TSR loss of 9% per year over five years. This makes us a little wary, but the business might have turned around its fortunes. While it is well worth considering the different impacts that market conditions can have on the share price, there are other factors that are even more important. Take risks, for example - Adacel Technologies has 4 warning signs (and 1 which shouldn't be ignored) we think you should know about.
Of course, you might find a fantastic investment by looking elsewhere. So take a peek at this free list of companies we expect will grow earnings.
Please note, the market returns quoted in this article reflect the market weighted average returns of stocks that currently trade on AU exchanges.
Have feedback on this article? Concerned about the content? Get in touch with us directly. Alternatively, email editorial-team (at) simplywallst.com.
This article by Simply Wall St is general in nature. We provide commentary based on historical data and analyst forecasts only using an unbiased methodology and our articles are not intended to be financial advice. It does not constitute a recommendation to buy or sell any stock, and does not take account of your objectives, or your financial situation. We aim to bring you long-term focused analysis driven by fundamental data. Note that our analysis may not factor in the latest price-sensitive company announcements or qualitative material. Simply Wall St has no position in any stocks mentioned.