
 Yahoo Finance
 Is AcuityAds Holdings Inc (CVE:AT) Excessively Paying Its CEO?

Tal Hayek has been the CEO of AcuityAds Holdings Inc (CVE:AT) since 2009. This analysis aims first to contrast CEO compensation with other companies that have similar market capitalization. After that, we will consider the growth in the business. And finally – as a second measure of performance – we will look at the returns shareholders have received over the last few years. The aim of all this is to consider the appropriateness of CEO pay levels.
View our latest analysis for AcuityAds Holdings
How Does Tal Hayek’s Compensation Compare With Similar Sized Companies?
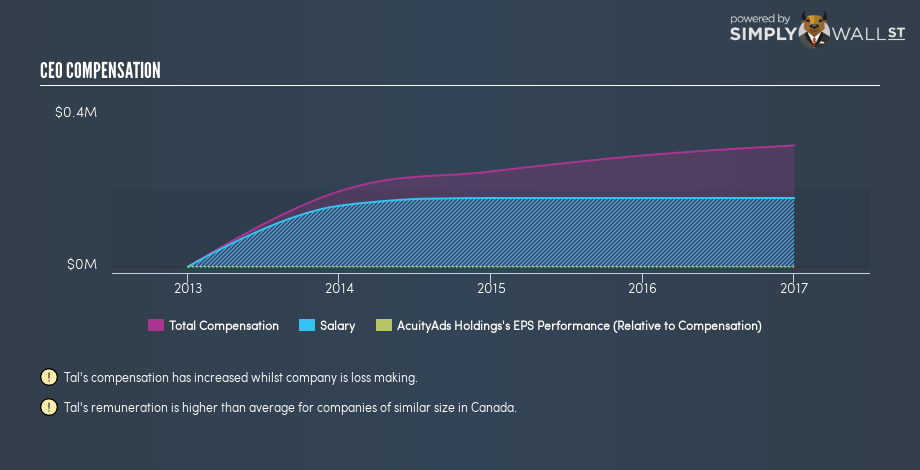
According to our data, AcuityAds Holdings Inc has a market capitalization of CA$48m, and pays its CEO total annual compensation worth CA$318k. We note that’s an increase of 9.0% above last year. We examined a group of similar sized companies, with market capitalizations of below CA$265m. The median CEO compensation in that group is CA$155k.
As you can see, Tal Hayek is paid more than the median CEO pay at companies of a similar size, in the same market. However, this does not necessarily mean AcuityAds Holdings Inc is paying too much. A closer look at the performance of the underlying business will give us a better idea about whether the pay is particularly generous.
You can see a visual representation of the CEO compensation at AcuityAds Holdings, below.
Is AcuityAds Holdings Inc Growing?
AcuityAds Holdings Inc has reduced its earnings per share by an average of 8.0% a year, over the last three years. It saw its revenue drop -12% over the last year.
Sadly for shareholders, earnings per share are actually down, over three years. And the fact that revenue is down year on year arguably paints an ugly picture. It’s hard to argue the company is firing on all cylinders, so shareholders might be averse to high CEO remuneration.
It could be important to check this free visual depiction of what analysts expect for the future.
Has AcuityAds Holdings Inc Been A Good Investment?
I think that the total shareholder return of 34%, over three years, would leave most AcuityAds Holdings Inc shareholders smiling. As a result, some may believe the CEO should be paid more than is normal for companies of similar size.
In Summary…
We compared the total CEO remuneration paid by AcuityAds Holdings Inc, and compared it to remuneration at a group of similar sized companies. We found that it pays well over the median amount paid in the benchmark group.
Neither earnings per share nor revenue have been growing sufficiently fast to impress us, over the last three years.
However, we can’t argue with the strong returns to shareholders, over the same time period. So on this analysis we’d stop short of criticizing the level of CEO compensation. Shareholders may want to check for free if AcuityAds Holdings Inc insiders are buying or selling shares.
Or you might prefer examine intently this intuitive graph showing past earnings and revenue.
To help readers see past the short term volatility of the financial market, we aim to bring you a long-term focused research analysis purely driven by fundamental data. Note that our analysis does not factor in the latest price-sensitive company announcements.
The author is an independent contributor and at the time of publication had no position in the stocks mentioned. For errors that warrant correction please contact the editor at editorial-team@simplywallst.com.
