
 Yahoo Finance
 5N Plus (TSE:VNP) shareholders have endured a 54% loss from investing in the stock five years ago
Generally speaking long term investing is the way to go. But along the way some stocks are going to perform badly. For example the 5N Plus Inc. (TSE:VNP) share price dropped 54% over five years. That is extremely sub-optimal, to say the least. And we doubt long term believers are the only worried holders, since the stock price has declined 52% over the last twelve months. Furthermore, it's down 40% in about a quarter. That's not much fun for holders.
So let's have a look and see if the longer term performance of the company has been in line with the underlying business' progress.
Check out our latest analysis for 5N Plus
To paraphrase Benjamin Graham: Over the short term the market is a voting machine, but over the long term it's a weighing machine. By comparing earnings per share (EPS) and share price changes over time, we can get a feel for how investor attitudes to a company have morphed over time.
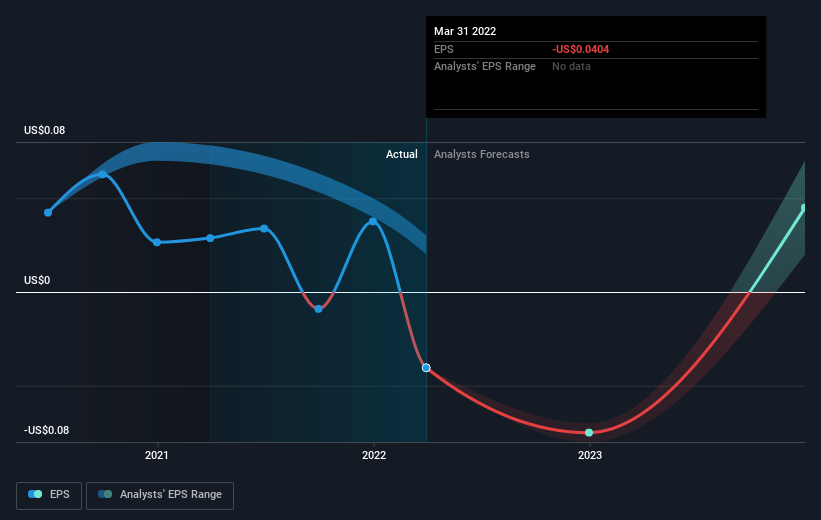
Over five years 5N Plus' earnings per share dropped significantly, falling to a loss, with the share price also lower. The recent extraordinary items contributed to this situation. Since the company has fallen to a loss making position, it's hard to compare the change in EPS with the share price change. But we would generally expect a lower price, given the situation.
The company's earnings per share (over time) is depicted in the image below (click to see the exact numbers).
It's probably worth noting we've seen significant insider buying in the last quarter, which we consider a positive. That said, we think earnings and revenue growth trends are even more important factors to consider. Dive deeper into the earnings by checking this interactive graph of 5N Plus' earnings, revenue and cash flow.
A Different Perspective
We regret to report that 5N Plus shareholders are down 52% for the year. Unfortunately, that's worse than the broader market decline of 0.3%. Having said that, it's inevitable that some stocks will be oversold in a falling market. The key is to keep your eyes on the fundamental developments. Regrettably, last year's performance caps off a bad run, with the shareholders facing a total loss of 9% per year over five years. We realise that Baron Rothschild has said investors should "buy when there is blood on the streets", but we caution that investors should first be sure they are buying a high quality business. I find it very interesting to look at share price over the long term as a proxy for business performance. But to truly gain insight, we need to consider other information, too. For instance, we've identified 4 warning signs for 5N Plus that you should be aware of.
5N Plus is not the only stock insiders are buying. So take a peek at this free list of growing companies with insider buying.
Please note, the market returns quoted in this article reflect the market weighted average returns of stocks that currently trade on CA exchanges.
Have feedback on this article? Concerned about the content? Get in touch with us directly. Alternatively, email editorial-team (at) simplywallst.com.
This article by Simply Wall St is general in nature. We provide commentary based on historical data and analyst forecasts only using an unbiased methodology and our articles are not intended to be financial advice. It does not constitute a recommendation to buy or sell any stock, and does not take account of your objectives, or your financial situation. We aim to bring you long-term focused analysis driven by fundamental data. Note that our analysis may not factor in the latest price-sensitive company announcements or qualitative material. Simply Wall St has no position in any stocks mentioned.
