
 Yahoo Finance
 Is 5N Plus Inc’s (TSE:VNP) ROE Of 9.95% Sustainable?

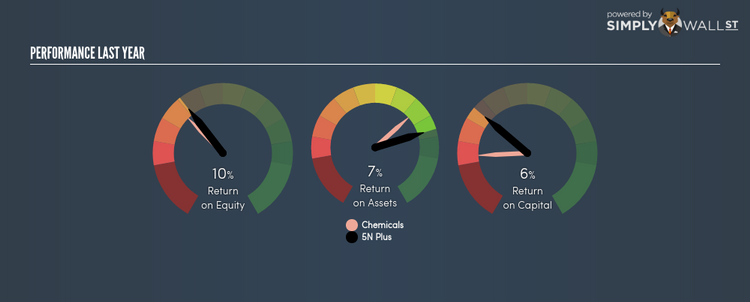
With an ROE of 9.95%, 5N Plus Inc (TSX:VNP) outpaced its own industry which delivered a less exciting 8.83% over the past year. While the impressive ratio tells us that VNP has made significant profits from little equity capital, ROE doesn’t tell us if VNP has borrowed debt to make this happen. We’ll take a closer look today at factors like financial leverage to determine whether VNP’s ROE is actually sustainable. Check out our latest analysis for 5N Plus
Peeling the layers of ROE – trisecting a company’s profitability
Return on Equity (ROE) weighs 5N Plus’s profit against the level of its shareholders’ equity. An ROE of 9.95% implies CA$0.1 returned on every CA$1 invested. In most cases, a higher ROE is preferred; however, there are many other factors we must consider prior to making any investment decisions.
Return on Equity = Net Profit ÷ Shareholders Equity
Returns are usually compared to costs to measure the efficiency of capital. 5N Plus’s cost of equity is 16.76%. This means 5N Plus’s returns actually do not cover its own cost of equity, with a discrepancy of -6.80%. This isn’t sustainable as it implies, very simply, that the company pays more for its capital than what it generates in return. ROE can be split up into three useful ratios: net profit margin, asset turnover, and financial leverage. This is called the Dupont Formula:
Dupont Formula
ROE = profit margin × asset turnover × financial leverage
ROE = (annual net profit ÷ sales) × (sales ÷ assets) × (assets ÷ shareholders’ equity)
ROE = annual net profit ÷ shareholders’ equity
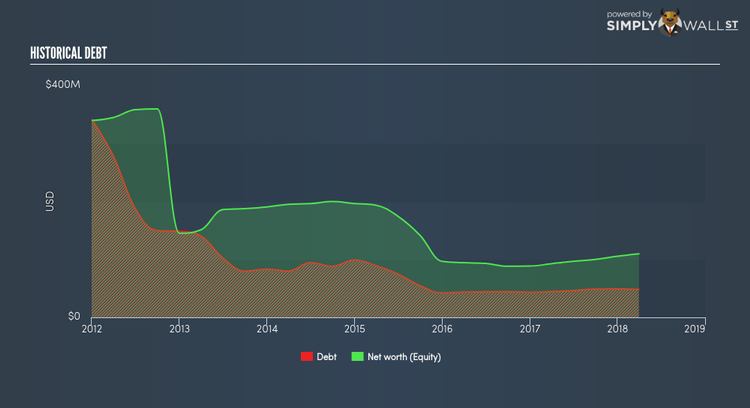
Basically, profit margin measures how much of revenue trickles down into earnings which illustrates how efficient the business is with its cost management. Asset turnover shows how much revenue 5N Plus can generate with its current asset base. Finally, financial leverage will be our main focus today. It shows how much of assets are funded by equity and can show how sustainable the company’s capital structure is. Since financial leverage can artificially inflate ROE, we need to look at how much debt 5N Plus currently has. At 44.07%, 5N Plus’s debt-to-equity ratio appears low and indicates the above-average ROE is generated from its capacity to increase profit without a large debt burden.
Next Steps:
While ROE is a relatively simple calculation, it can be broken down into different ratios, each telling a different story about the strengths and weaknesses of a company. 5N Plus’s ROE is impressive relative to the industry average, though its returns were not strong enough to cover its own cost of equity. ROE is not likely to be inflated by excessive debt funding, giving shareholders more conviction in the sustainability of industry-beating returns. ROE is a helpful signal, but it is definitely not sufficient on its own to make an investment decision.
For 5N Plus, there are three relevant factors you should look at:
Financial Health: Does it have a healthy balance sheet? Take a look at our free balance sheet analysis with six simple checks on key factors like leverage and risk.
Valuation: What is 5N Plus worth today? Is the stock undervalued, even when its growth outlook is factored into its intrinsic value? The intrinsic value infographic in our free research report helps visualize whether 5N Plus is currently mispriced by the market.
Other High-Growth Alternatives : Are there other high-growth stocks you could be holding instead of 5N Plus? Explore our interactive list of stocks with large growth potential to get an idea of what else is out there you may be missing!
To help readers see pass the short term volatility of the financial market, we aim to bring you a long-term focused research analysis purely driven by fundamental data. Note that our analysis does not factor in the latest price sensitive company announcements.
The author is an independent contributor and at the time of publication had no position in the stocks mentioned.
