
 Yahoo Finance
 5 Cheap Stocks to Buy in 2019
One of the biggest mistakes investors make -- especially beginners -- is assuming that a low price means a stock is cheap. For a litany of reasons, including how much of the company each share is worth and how big the company is in terms of revenues and earnings, sometimes a $5 stock is actually more "expensive" than a $50 stock. Moreover, "cheap" can mean different things depending on the metric being used to value a stock and what it's being compared against. And that's before we even consider a company's growth potential, dividend yield, or other aspects of its business that could affect its stock price.
In other words, a cheap price doesn't always equal a cheap stock; in many cases, the stocks trading for the lowest stock price actually have some of the highest risk and limited likelihood of helping you make money. Below is a quick primer on how investors can find the real bargains in the stock market, using measures such as price-to-earnings ratio, cash flows, or asset value to value a stock and factoring in a company's growth potential and dividend yield to identify whether they make the mark as cheap.
Price is what you pay; value is what you get. Image source: Getty Images.
What is a cheap stock?
A cheap stock trades for a discount to one or more measures of valuation such as price-to-earnings (or P/E) ratio, cash flows, or the book value of its assets when compared either to its historical value or to that of similar companies. In other words, the first step is to move beyond the stock price -- which is frankly meaningless as a stand-alone measure of value -- and use metrics that normalize for variations in share price, share count, and a company's market value.
How can I tell whether a stock is cheap?
In general terms, a company's value, and hence the value of its stock, is tied to its earnings capacity, cash flows, and the value of the assets it owns. For this reason, and since different metrics are appropriate from one industry to another, it's important to have a decent understanding of some key metrics and what they can tell you.
P/E ratio
The price-to-earnings ratio is a simple formula: share price divided by earnings per share. This metric "normalizes" a company's earnings capacity for its stock price and share count. The resulting P/E ratio can then be used to compare a company's valuation to that of its competitors, its industry average, or its historical valuation. Since a company's ability to generate earnings is typically the most important measure of its worth, this is a go-to metric when looking for cheap stocks.
In general, there are two different kinds of P/E ratio: trailing and forward. The trailing P/E ratio typically measures a company's earnings over the past 12 reported financial months, while the forward P/E is generally the average estimated earnings supplied by Wall Street analysts who follow the company. If a company offers guidance for future earnings, investors can use it to determine a forward P/E against what management expects the company to earn.
Cash flows
Earnings don't always equal cash: Various accounting requirements such as depreciation and amortization can spread the impact of big cash expenditures over multiple years on the earnings statement. Moreover, it's important to understand how a company generated its cash -- did it sell off assets, or did the cash come from operations? -- as well as how much it generated. There are several different ways to measure a company's cash flows, but cash from operations and free cash flow are two of the best.
Cash from operations
Also called operating cash flow, it's exactly what it sounds like: how much cash a company makes from its core business operations. This number can be found on a company's cash flow statement in its quarterly 10-Q and annual 10-K filings. To better explain what it is, we can look at other ways a company may generate (or consume) cash that aren't from operations. Investing activities, including selling or acquiring assets such as property, equipment, or even stocks and bonds, can make or cost a company cash. So can financing activities, including a company's efforts to raise capital, such as issuing or repurchasing company stock, issuing or paying off debt, and making dividend payments.
In short, by removing the cash flows (or cash consumption) from these nonoperations activities, investors can get a better idea of a company's ability to generate cash from its core business.
Like the P/E ratio, there's a formula to normalize this metric, called price-to-cash from operations per share, or price-to-CFO per share for short. To find it, just divide price by CFO per share.
Free cash flow
This measure takes cash from operations one step further with the following formula: Cash from operations minus capital expenditures (capex) equals free cash flow. After you subtract capital expenditures -- what a company spends to maintain existing assets and purchase new ones -- the resulting measure essentially shows you how much cash a company has left over to do with as it chooses.
Similar to cash from operations, investors can normalize this measure to the share price with the same formula as above. However, since capital expenditures can vary greatly for many companies from one period to the next, this metric requires more analysis of a company's capex spending with an eye on the long-term trends. One year of low capex spending can make a stock look cheaper than it might actually be, particularly if this year's capex reduction will result in higher capex spending in the future.
Book value
While the metrics above focus on a company's ability to make money, book value measures the value of a company's assets after subtracting all of its liabilities. What's left over is its book value. This is generally expressed on a per-share basis. For valuation purposes, it's called price-to-book value ratio, or simply P/B.
One of the oldest and most commonly used value measures, price-to-book value can be an excellent tool to identify potential bargains by comparing a company's book value to its historical multiple or to that of similar peers.
However, it's worth noting that a company's book value can change, and just because a stock sells for a discount to book value -- anything less than 1 times book value means a stock sells for less than the book value of a company's assets -- that doesn't guarantee that it's cheap.
That's particularly true if a company isn't profitable (it may have to sell assets or take on debt to raise capital, diluting per-share book value) or if the carrying value of its assets on the balance sheet doesn't reflect their real market value (for example, if a company closes a factory, writing down the value of its assets as a result).
In summary, book value can be a valuable tool, particularly for industries with hard assets that are more straightforward to value. Just take the time to put in the work to make sure there's real value to back it up.
How to find cheap stocks
A good place to start is using a stock screener, which is a tool to search for stocks based on certain parameters. For instance, if one were to run a screener looking at retailers based on P/E ratio, Kohl's would look cheap, trading for 13.6 times trailing earnings and 10.9 times forward earnings estimates. That same screener would also show TJX Companies (NYSE: TJX) and Ross Stores (NASDAQ: ROST) trading for much higher P/E multiples: above 21 times trailing earnings and 20 times forward earnings estimates.
But at this point, we're only talking about numbers on a screen and not considering what they mean in relation to three different businesses. This is where you take what the screener gives you as a starting point and do some actual analysis.
And any analysis of the three shows that Ross and TJX are thriving, with strong prospects to open more stores even as more retail moves online, while Kohl's is in the early stages of "right-sizing" its existing store footprint. The past five years' sales bear this out:

KSS Revenue (TTM) data by YCharts.
Moreover, Ross Stores' and TJX's business model, built on buying closeout and excess merchandise, is simply more profitable than Kohl's fashion-focused retail strategy while also proving rather resistant to e-commerce. Here is a comparison of their operating margins -- that is, the profitability of sales after removing both product costs and operating expenses:

ROST Operating Margin (TTM) data by YCharts.
To put it simply, Kohl's stock should trade at a lower valuation than Ross and TJX based on the differences in their businesses and the fact that the two discounters are thriving in the e-commerce shift while Kohl's is, if not struggling, then certainly in the midst of a transition.
But should Kohl's trade for such a discount to its faster-growing, closeout-focused peers? A metric we can use to help determine this is the PEG ratio, or price-to-earnings growth ratio. In short, this metric uses the current price-to-earnings ratio divided by the company's earnings growth rate.

KSS PEG Ratio (Forward 1y) data by YCharts.
While the PEG ratio doesn't normalize every aspect of comparing different businesses, it certainly paints a picture that Kohl's is a cheap stock, at least by the numbers. In general, a PEG ratio around 1 is considered fair value, and anything below 1 is cheap.
So there you have it: In this example, I think it's fair to call Kohl's pretty cheap, based on these measures and the quality of its business. Let's take a closer look at what other factors make Kohl's look cheap, along with four more cheap stocks that look worth buying in 2019.
Here are five cheap stocks to buy in 2019
Stock | TTM* P/E | Forward P/E | Dividend Yield |
|---|---|---|---|
AT&T (NYSE: T) | 11.7 | 8.8 | 6.5% |
Delta Air Lines (NYSE: DAL) | 9.2 | 8.2 | 2.5% |
Ford Motor Company (NYSE: F) | 13.2 | 7.4 | 5.8% |
Kohl's (NYSE: KSS) | 13.2 | 10.6 | 3.9% |
Wells Fargo (NYSE: WFC) | 10.1 | 9.8 | 3.8% |
As of May 15, 2019. TTM = trailing 12 months.
While all five of the stocks above may look cheap on paper, there's more to the story than just low valuations. After all, the numbers you see above may naturally change over time. Keep reading below for a deeper dive into each company, including what makes them compelling investments, short-term and long-term risks, growth potential, and what investors should watch going forward.
AT&T
The past several years haven't been particularly kind to AT&T shareholders. From the peak in July of 2016 through the spring of 2019, the company's share price lost well over 25% of its value, with the vast majority of that drop coming in 2018:
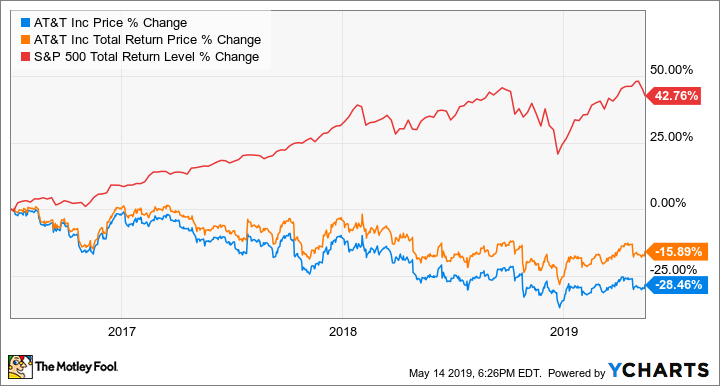
Even when you factor in its dividend, investors have still seen double-digit losses; adding insult to that injury, it happened while the stock market roared ever higher.
After we've spent hundreds of words telling you that share price isn't where you find value, why do we bring this up? Because while the share price alone doesn't indicate whether there's value, understanding why a company's share price has gone up or down over a period of time can tell you a lot.
And in the case of AT&T, the past few years haven't exactly gone swimmingly. The company's legacy landline businesses are in a state of decline as more people and businesses "cut the cord," while its wireless business is relatively mature and hasn't had many catalysts for growth over the past half decade. This led management to make several big investments, including its ill-advised acquisition of DirecTV (which is now rapidly losing subscribers) and more recently the $85 billion purchase of Time Warner (for which most analysts said it substantially overpaid) in 2018.
Make no bones about it: AT&T management has made some poor capital allocation decisions, with its cash flows roughly flat on a per-share basis since 2014.

T CFO Per Share (TTM) data by YCharts.
Now that we've beaten the company up pretty soundly, let's talk about why it's cheap -- and why it's worth buying.
As much as management hasn't done the best job with acquisitions recently -- a lesson it's likely taking to heart, based on AT&T's plan to improve its balance sheet -- the company is a cash-cow business, particularly its quite solid wireless segment. And while its cash flows haven't really grown much in recent years, they're more than sufficient to maintain its dividend.
Moreover, it trades at a pretty steep discount to its historical P/E ratio while paying a very generous dividend yield.

T PE Ratio (TTM) data by YCharts.
The company may not grow earnings at a very high rate in the years ahead. But a dividend yield above 6% significantly lowers the bar for how much earnings growth the company needs to deliver to make for a market-beating investment.
What are the risks investors should watch for? Because of the recurring nature of its revenue streams and the reality that most of its services are necessities across economic cycles, the bulk of AT&T's business is pretty recession resistant. That means if there were a slowdown in the economy, its business prospects would be mostly unchanged, though its stock price would likely still fall. While that's not a short-term risk to the business, it is a short-term risk to the stock price that investors should consider as an opportunity to buy more.
Over the long term, the biggest risk is more poor execution by management. The good news is that the current plan, which is heavily focused on paying down debt, should be relatively easy to execute simply by using existing cash flows to pay off debt. If management were to change course, such as taking on more debt to fund another splashy acquisition, that would be a serious red flag.
But at recent prices and valuations, it appears Mr. Market is pricing that risk in already, which is part of what makes AT&T cheap and worth buying today.
Delta Air Lines
While AT&T is a cheap investment based on a high yield making up for relatively weak growth prospects, Delta Air Lines offers investors a combination of a cheap price that's heavily based on its growth potential. Trading for 9.8 times trailing and 8.7 times forward earnings estimates as of May 2019, Delta isn't particularly cheap, but when you dig in a little more, its PEG ratio of 0.8 is well below the standard of 1.0 that indicates fair value.
Moreover, the company is taking multiple steps that should boost long-term earnings growth. In early 2018, it extended its partnership with American Express, which more than doubled the amount of revenue it generated for Delta from 2012 to 2018 and is expected to more than double in value again, to $7 billion for Delta by 2023. This partnership, along with increased sales of premium products and a dominant position in many domestic and international markets, continues to help Delta deliver solid growth, with revenue up 8% year to date as of spring 2019.
Delta's also taking actions to become more efficient, announcing in early 2018 a plan to accelerate the retirement of its oldest, least-efficient aircraft by 2021. This step will help the company continue to drive operating costs down in both fuel consumption and maintenance expense.
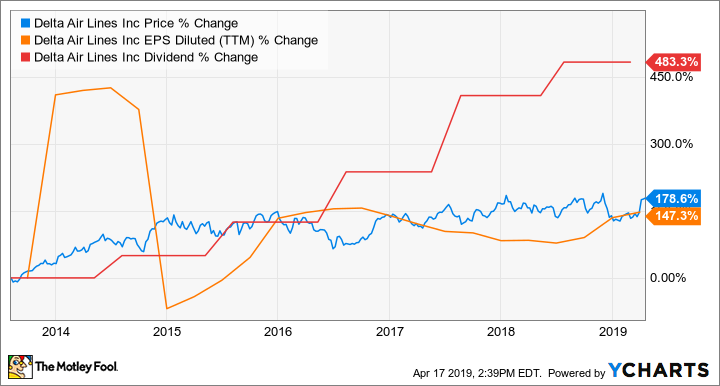
A combination of smart growth and rigorous focus on efficiency is expected to continue driving Delta's earnings higher over the long term, and that should allow the company to regularly raise its dividend to further reward shareholders.
The biggest risk for Delta is how it will manage the next inevitable economic slowdown. At some point, there will be a recession in one or more of the markets Delta serves, and that will put a squeeze on the company's results. However, Delta's management has proven very capable of operating across economic environments, and recessions are generally short term in nature. Most likely, a stock market sell-off because of a recession would create an opportunity to buy Delta stock at another cheap price.
Simply put, its cash flows give Delta substantial financial strength, and its long-term growth potential more than offsets any short-term risks for investors willing to buy and hold.
Ford Motors
Like AT&T's, Ford's investors haven't had a very good run in recent years. Going back to the start of 2014, Ford's share price has ended every year lower than it started:

Unlike AT&T's, Ford's bad half decade wasn't a product of bad acquisitions but of poor capital allocation decisions by management -- particularly several international expansion efforts -- that simply haven't paid off, including big losses in China, ongoing struggles in South America, and enough problems in Russia that Ford is exiting Russia's passenger vehicle market completely.
However, unlike AT&T's reaching outside its core business to buy growth, Ford should get at least somewhat of a pass. A big part of the reason the automaker's efforts to grow sales outside North America haven't produced much fruit is the highly cyclical nature of automobile demand. Ford has simply made moves at bad times in recent years.
Moreover, the North American auto market is in a bit of a downturn. For instance, Ford delivered 2% fewer vehicles in the U.S. to start 2019 than in the same period in 2018. This comes on the heels of a 2018 that saw Ford's operating profits fall 28% on the combination of international struggles and higher-than-expected expenses in North America.
Yet another dreary story, right? Yet also like AT&T, it looks like Mr. Market is pricing too much doom and gloom in for Ford. Trading for 7.2 times 2019 earnings estimates and paying a dividend yield near 6%, Ford is worth buying today and holding through both the company's efforts to improve its business and the automotive demand cycle.
Worried about the risk that Ford won't be able to maintain the dividend if auto demand weakens further? That's a cogent concern, but there's good news. The dividend only requires a small portion of cash flows to cover: Even with the 28% decline in operating profits last year, Ford's cash payout ratio -- the portion of its cash flows it pays out in dividends -- was only 40% in 2018, and it fell to 32% after the first quarter.
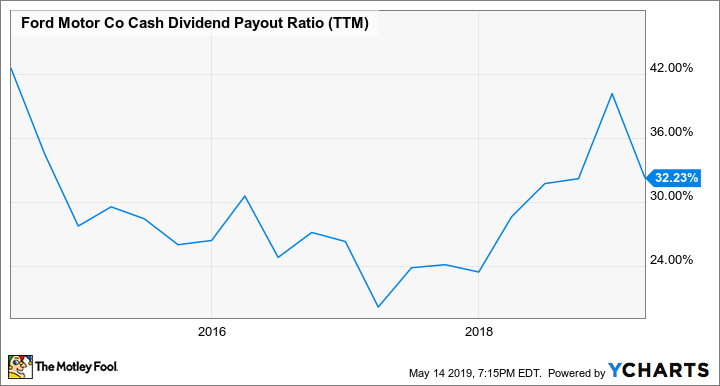
F Cash Dividend Payout Ratio (TTM) data by YCharts.
Lastly, Ford carries a veritable fortress of cash on its balance sheet, with nearly $34 billion at the end of 2018, giving it a substantial margin of safety to ride out any protracted downturn while still supporting the payout.
Ford's combination of strong, cash-producing operations and a balance sheet built to ride out cyclical weakness made it a worthy business. Combine that with a very low earnings multiple and a very high dividend yield, and Ford makes for a cheap dividend stock worth buying.
Kohl's
Let's summarize what we've already learned about Kohl's:
Its stock trades for a relative discount to several of its peers, even adjusting for differences in the business; a PEG ratio of 0.77 times is certainly cheap.
Like other struggling brick-and-mortar retailers, it is dealing with stores that are too big, and this extra real estate is costing it money.
Yet even with its struggles, Kohl's has a number of things in its favor, and management seems to be pulling the right levers to maximize the value of its excess real estate holdings over the long term.
Moreover, Kohl's is outperforming its department-store peers. In last year's critically important holiday season, the department-store category reported a 1.3% drop in sales, a terrible result considering that total retail holiday sales in the U.S. increased 5.1% over the period. In particular, major chains like J.C. Penney and Sears continue to struggle. The latter is closing hundreds of stores, while Penney, which has already closed dozens of locations, is likely to go through another round of closures in the not-too-distant future.
Kohl's reported a solid fourth quarter to end 2018. Comparable sales -- sales at stores open more than one year -- were up 1% in the period, far better than its peer average, as noted above. And while revenue fell 3.3% in the quarter, that was due to the 2017 fiscal fourth quarter being a full week longer than 2018's.
Here's the kicker: Sales were relatively modest, yet Kohl's reported a solid 20% increase in adjusted earnings per share to finish out 2018. That's strong evidence that management's plan to improve the business is working.
What's interesting about Kohl's plans for excess real estate is that the company is not focusing on closing stores; frankly, most of its retail footprint is well located and viable for a Kohl's store. The issue is that they're just too big, so management has started shrinking stores and finding good retail tenant partners to whom to lease the excess space.
Recently, Kohl's partnered with Planet Fitness, the fast-growing gym operator, to lease 20,000 to 25,000 square feet from 10 Kohl's stores, a similar strategy to the deal it struck with the privately owned grocery chain Aldi in 2017. What makes these two partnerships -- and what could likely be many more to follow -- most attractive is that Kohl's won't just benefit from getting some cash flows from the rent, but it should also benefit from the traffic its tenants attract.
The Planet Fitness partnership in particular is quite compelling, considering that 20% of Kohl's sales come from activewear, athletic shoes, and related accessories.
In other words, Kohl's isn't just a struggling retailer with a cheap stock. It's making very real progress, it remains solidly profitable, and its management is taking very real action to improve the business in meaningful ways.
Moreover, Kohl's balance sheet is in good shape; debt has fallen over 40% since the peak in late 2015 to a manageable $1.9 billion, while the dividend was covered by only 26% of 2018 cash flows.
There are risks, of course. Retail success is heavily tied to the whims of the economy, and at some point, there will be a slowdown. So long as management continues to keep the balance sheet strong, the company is built to withstand a downturn. However, such an economic hit would almost certainly result in a short-term drop in the stock price. If you invest, make sure you're willing and able to hold through any economic downturn, and even consider adding to your shares if the stock does fall further.
Still, within Kohl's risk, there is substantial opportunity. Kohl's is very well run, it's profitable, and it has a plan that should result in meaningful growth in earnings and cash flows over the long term. Considering the current valuation, it's my top retail stock investors can buy on the cheap right now.
Wells Fargo
If there's a more beleaguered bank in America than Wells Fargo as of this writing, I can't think of it. A massive 2016 Wells Fargo scandal revealed that the bank fraudulently opened several million accounts in customers' names without their consent, which led to a landslide of lawsuits, fines from regulators, and the removal of the bank's longtime CEO.
And that was just the beginning. The U.S. Federal Reserve, Wells' primary regulator, took an unprecedented step in its punishment of the megabank, prohibiting it from growing its assets any larger than it held at the end of 2017 until regulators saw what it described as "sufficient improvements." Considering the rising-interest-rate environment we have experienced since the end of 2017, Wells has been locked out of what likely could have been one of the best periods to grow assets in years.
Furthermore, it looks like the Fed's restrictions played a big role in Wells Fargo losing another CEO. Tim Sloan's abrupt retirement in late March was almost certainly tied to regulators refusing to remove the growth sanction so long as Sloan, an executive with Wells for many years, remained at the helm.
On one hand, Sloan being forced out was a disappointment. Despite his long association with Wells, the bank has made meaningful changes during his tenure, and even with the growth handcuffs firmly in place, the big bank has delivered very strong earnings growth.
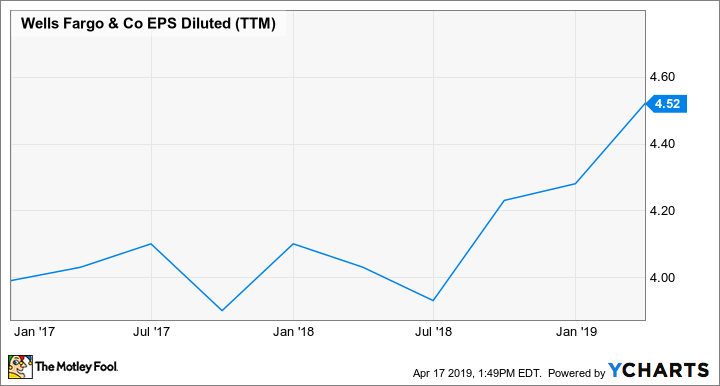
WFC EPS Diluted (TTM) data by YCharts.
In other words, just because Wells can't grow its assets doesn't mean it can't grow its profits. Despite some very -- very -- stupid actions in its retail operations, Wells continues to prove that its lending standards weren't subject to the same kind of mismanagement, and its assets continue to generate very strong returns.
Moreover, after some initial churn with customers leaving following the fake account scandal, its deposit base has remained relatively stable. This serves as a strong reminder that consumers often have a very short attention span when it comes to these sorts of major PR gaffes.
Yet Mr. Market continues to treat Wells as if it's in more trouble than it is, with its shares trading for a meaningful discount to its historical earnings multiple and to those of many of its big-bank peers:
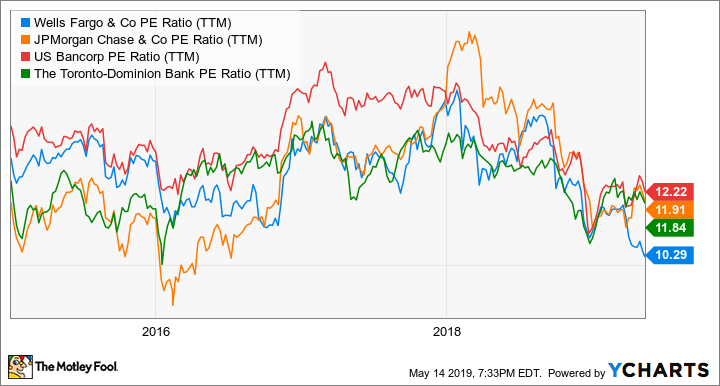
WFC PE Ratio (TTM) data by YCharts.
Wells is an excellent example of utilizing book value to find a cheap stock, since a bank's book value is mostly made up of its loan portfolio and cash on the balance sheet, two items that are relatively straightforward to value, as compared to, say, a fashion retailer's inventory (Ross and TJX have built entire businesses on the ability to buy those items at big discounts) or a carmaker's assembly plants (Ford has taken billions in writedowns to its manufacturing assets in recent years).
By book value, Wells is as cheap as it's been in the past half decade:
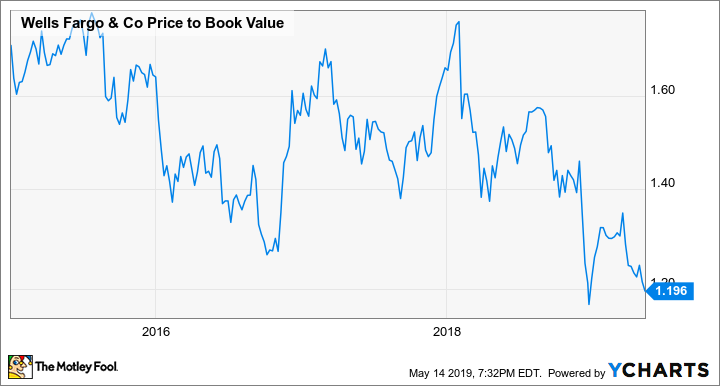
WFC Price to Book Value data by YCharts.
Moreover, the value of Wells' dividend, easily the highest yield among its U.S. megabank peers, makes it even more appealing.
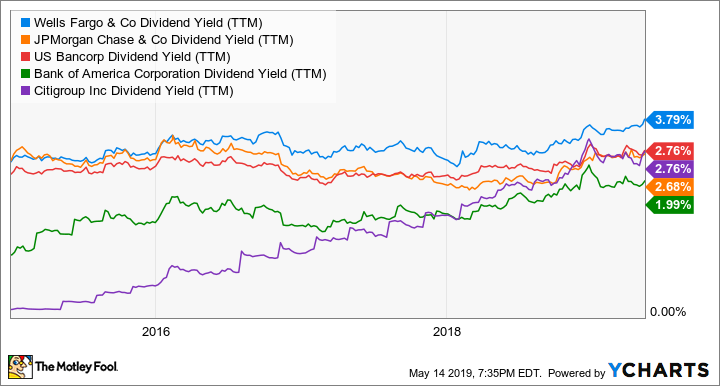
WFC Dividend Yield (TTM) data by YCharts.
Add it all up, and Wells offers a combination of financial strength and the ability to deliver earnings growth even with a cap on assets, a best-in-class dividend, and a meaningful discount to its valuation. Even without a clear end in sight from regulators on the restrictions, Wells Fargo is set to deliver solid returns for investors. When the handcuffs finally do come off, today's price will almost certainly look like a bargain.
Cheap stocks can make you money, but diversify and expect to be wrong sometimes
It can be a lot of fun -- and quite profitable -- to find a great stock on the cheap. However, investing is an inexact science, and you're bound to buy a company that looks like a bargain to you but ends up losing even more value when the thesis plays out and it turns out you missed something important.
That's OK; no investor gets it right every time. This is the main reason why successful investing requires some degree of diversification. Even if you make a terrible pick and buy shares of a company that goes belly-up, getting it right on another high-quality business can deliver returns that more than make up for the occasional flub.
Moreover, consider the risks for each company just as deeply as the upside. Not only can this help you uncover weaknesses you may have overlooked in your optimism, but it can also help you maintain discipline and not risk more money on any single stock than you're willing to lose if things go bad.
More From The Motley Fool
Jason Hall owns shares of Ford. The Motley Fool owns shares of and recommends Delta Air Lines. The Motley Fool recommends Planet Fitness and The TJX Companies. The Motley Fool has a disclosure policy.
