
 Yahoo Finance
 These 4 Measures Indicate That Kendrion (AMS:KENDR) Is Using Debt Extensively

Legendary fund manager Li Lu (who Charlie Munger backed) once said, 'The biggest investment risk is not the volatility of prices, but whether you will suffer a permanent loss of capital.' When we think about how risky a company is, we always like to look at its use of debt, since debt overload can lead to ruin. We note that Kendrion N.V. (AMS:KENDR) does have debt on its balance sheet. But is this debt a concern to shareholders?
What Risk Does Debt Bring?
Generally speaking, debt only becomes a real problem when a company can't easily pay it off, either by raising capital or with its own cash flow. Part and parcel of capitalism is the process of 'creative destruction' where failed businesses are mercilessly liquidated by their bankers. However, a more usual (but still expensive) situation is where a company must dilute shareholders at a cheap share price simply to get debt under control. Having said that, the most common situation is where a company manages its debt reasonably well - and to its own advantage. The first step when considering a company's debt levels is to consider its cash and debt together.
See our latest analysis for Kendrion
What Is Kendrion's Net Debt?
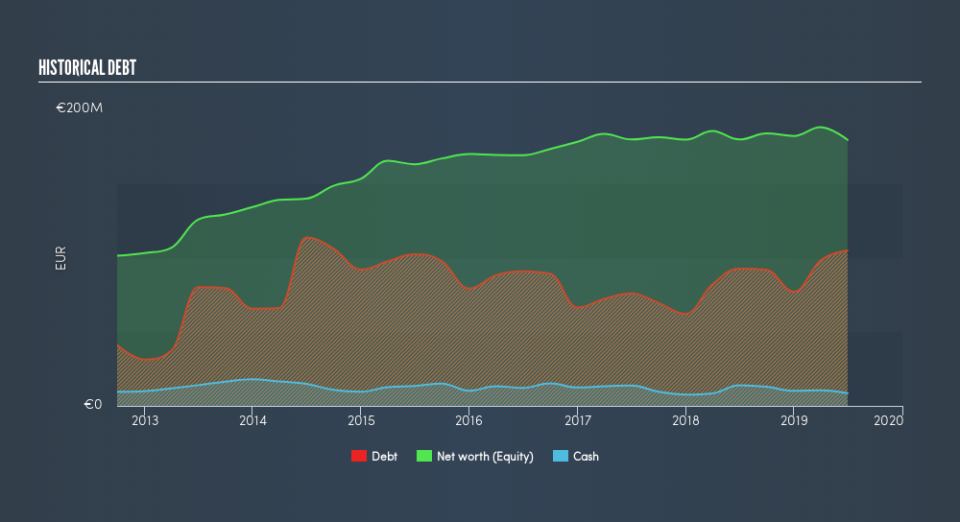
As you can see below, Kendrion had €90.8m of debt, at June 2019, which is about the same the year before. You can click the chart for greater detail. However, it also had €8.60m in cash, and so its net debt is €82.2m.
How Strong Is Kendrion's Balance Sheet?
The latest balance sheet data shows that Kendrion had liabilities of €85.9m due within a year, and liabilities of €117.2m falling due after that. On the other hand, it had cash of €8.60m and €64.3m worth of receivables due within a year. So it has liabilities totalling €130.2m more than its cash and near-term receivables, combined.
While this might seem like a lot, it is not so bad since Kendrion has a market capitalization of €225.4m, and so it could probably strengthen its balance sheet by raising capital if it needed to. However, it is still worthwhile taking a close look at its ability to pay off debt.
We use two main ratios to inform us about debt levels relative to earnings. The first is net debt divided by earnings before interest, tax, depreciation, and amortization (EBITDA), while the second is how many times its earnings before interest and tax (EBIT) covers its interest expense (or its interest cover, for short). Thus we consider debt relative to earnings both with and without depreciation and amortization expenses.
We'd say that Kendrion's moderate net debt to EBITDA ratio ( being 1.9), indicates prudence when it comes to debt. And its strong interest cover of 1k times, makes us even more comfortable. Importantly, Kendrion's EBIT fell a jaw-dropping 37% in the last twelve months. If that earnings trend continues then paying off its debt will be about as easy as herding cats on to a roller coaster. The balance sheet is clearly the area to focus on when you are analysing debt. But it is future earnings, more than anything, that will determine Kendrion's ability to maintain a healthy balance sheet going forward. So if you want to see what the professionals think, you might find this free report on analyst profit forecasts to be interesting.
Finally, a business needs free cash flow to pay off debt; accounting profits just don't cut it. So we clearly need to look at whether that EBIT is leading to corresponding free cash flow. In the last three years, Kendrion's free cash flow amounted to 40% of its EBIT, less than we'd expect. That's not great, when it comes to paying down debt.
Our View
We'd go so far as to say Kendrion's EBIT growth rate was disappointing. But on the bright side, its interest cover is a good sign, and makes us more optimistic. Once we consider all the factors above, together, it seems to us that Kendrion's debt is making it a bit risky. Some people like that sort of risk, but we're mindful of the potential pitfalls, so we'd probably prefer it carry less debt. Another positive for shareholders is that it pays dividends. So if you like receiving those dividend payments, check Kendrion's dividend history, without delay!
At the end of the day, it's often better to focus on companies that are free from net debt. You can access our special list of such companies (all with a track record of profit growth). It's free.
We aim to bring you long-term focused research analysis driven by fundamental data. Note that our analysis may not factor in the latest price-sensitive company announcements or qualitative material.
If you spot an error that warrants correction, please contact the editor at editorial-team@simplywallst.com. This article by Simply Wall St is general in nature. It does not constitute a recommendation to buy or sell any stock, and does not take account of your objectives, or your financial situation. Simply Wall St has no position in the stocks mentioned. Thank you for reading.
