
 Yahoo Finance
 The 33% return delivered to Kilroy Realty's (NYSE:KRC) shareholders actually lagged YoY earnings growth
There's no doubt that investing in the stock market is a truly brilliant way to build wealth. But not every stock you buy will perform as well as the overall market. Over the last year the Kilroy Realty Corporation (NYSE:KRC) share price is up 29%, but that's less than the broader market return. In contrast, the longer term returns are negative, since the share price is 3.3% lower than it was three years ago.
After a strong gain in the past week, it's worth seeing if longer term returns have been driven by improving fundamentals.
See our latest analysis for Kilroy Realty
There is no denying that markets are sometimes efficient, but prices do not always reflect underlying business performance. One way to examine how market sentiment has changed over time is to look at the interaction between a company's share price and its earnings per share (EPS).
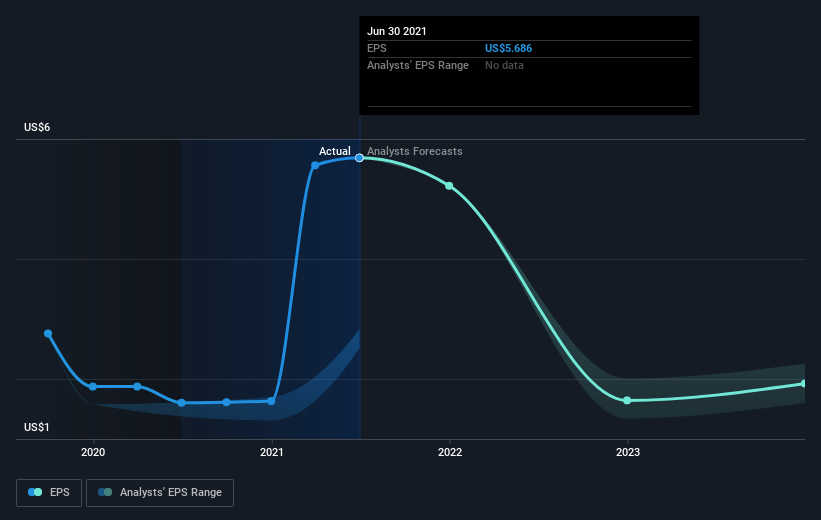
During the last year Kilroy Realty grew its earnings per share (EPS) by 254%. This EPS growth is significantly higher than the 29% increase in the share price. Therefore, it seems the market isn't as excited about Kilroy Realty as it was before. This could be an opportunity.
The graphic below depicts how EPS has changed over time (unveil the exact values by clicking on the image).
We know that Kilroy Realty has improved its bottom line over the last three years, but what does the future have in store? Take a more thorough look at Kilroy Realty's financial health with this free report on its balance sheet.
What About Dividends?
As well as measuring the share price return, investors should also consider the total shareholder return (TSR). The TSR incorporates the value of any spin-offs or discounted capital raisings, along with any dividends, based on the assumption that the dividends are reinvested. So for companies that pay a generous dividend, the TSR is often a lot higher than the share price return. We note that for Kilroy Realty the TSR over the last 1 year was 33%, which is better than the share price return mentioned above. And there's no prize for guessing that the dividend payments largely explain the divergence!
A Different Perspective
Kilroy Realty's TSR for the year was broadly in line with the market average, at 33%. That gain looks pretty satisfying, and it is even better than the five-year TSR of 3% per year. It is possible that management foresight will bring growth well into the future, even if the share price slows down. I find it very interesting to look at share price over the long term as a proxy for business performance. But to truly gain insight, we need to consider other information, too. Take risks, for example - Kilroy Realty has 3 warning signs (and 2 which don't sit too well with us) we think you should know about.
Of course Kilroy Realty may not be the best stock to buy. So you may wish to see this free collection of growth stocks.
Please note, the market returns quoted in this article reflect the market weighted average returns of stocks that currently trade on US exchanges.
This article by Simply Wall St is general in nature. We provide commentary based on historical data and analyst forecasts only using an unbiased methodology and our articles are not intended to be financial advice. It does not constitute a recommendation to buy or sell any stock, and does not take account of your objectives, or your financial situation. We aim to bring you long-term focused analysis driven by fundamental data. Note that our analysis may not factor in the latest price-sensitive company announcements or qualitative material. Simply Wall St has no position in any stocks mentioned.
Have feedback on this article? Concerned about the content? Get in touch with us directly. Alternatively, email editorial-team (at) simplywallst.com.
