
 Yahoo Finance
 With A -16% Earnings Drop, Did Renren Inc (NYSE:RENN) Really Underperform?

Examining Renren Inc’s (NYSE:RENN) past track record of performance is a useful exercise for investors. It allows us to reflect on whether the company has met or exceed expectations, which is a powerful signal for future performance. Below, I will assess RENN’s latest performance announced on 30 June 2018 and weight these figures against its longer term trend and industry movements.
View our latest analysis for Renren
Was RENN’s weak performance lately a part of a long-term decline?
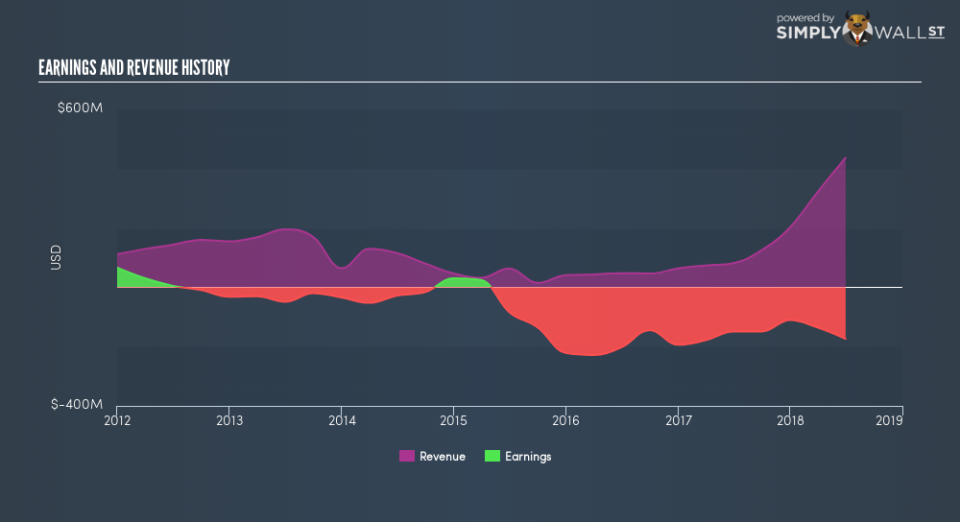
RENN is loss-making, with the most recent trailing twelve-month earnings of -US$173.7m (from 30 June 2018), which compared to last year has become more negative. Furthermore, the company’s loss seem to be growing over time, with the five-year earnings average of -US$82.2m. Each year, for the past five years RENN has seen an annual increase in operating expense growth, outpacing revenue growth of 22%, on average. This adverse movement is a driver of the company’s inability to reach breakeven.
Looking at growth from a sector-level, the US specialty retail industry has been growing its average earnings by double-digit 28% over the previous year,
Given that Renren is not profitable, even if operating expenses (SG&A and one-year R&D) continues to fall at previous year’s rate of -14%, the company’s current cash level (US$31m) will still be insufficient to cover its expenses in the upcoming year. This is not a great sign in terms of operations and cash management. Although this is a relatively simplistic calculation, and Renren may continue to reduce its costs further or open a new line of credit instead of issuing new equity shares, the analysis still gives us an idea of the company’s timeline and when things will have to start changing, since its current operation is unsustainable.
What does this mean?
Though Renren’s past data is helpful, it is only one aspect of my investment thesis. Companies that incur net loss is always hard to forecast what will occur going forward, and when. The most valuable step is to assess company-specific issues Renren may be facing and whether management guidance has consistently been met in the past. I suggest you continue to research Renren to get a more holistic view of the stock by looking at:
Financial Health: Are RENN’s operations financially sustainable? Balance sheets can be hard to analyze, which is why we’ve done it for you. Check out our financial health checks here.
Valuation: What is RENN worth today? Is the stock undervalued, even when its growth outlook is factored into its intrinsic value? The intrinsic value infographic in our free research report helps visualize whether RENN is currently mispriced by the market.
Other High-Performing Stocks: Are there other stocks that provide better prospects with proven track records? Explore our free list of these great stocks here.
NB: Figures in this article are calculated using data from the trailing twelve months from 30 June 2018. This may not be consistent with full year annual report figures.
To help readers see past the short term volatility of the financial market, we aim to bring you a long-term focused research analysis purely driven by fundamental data. Note that our analysis does not factor in the latest price-sensitive company announcements.
The author is an independent contributor and at the time of publication had no position in the stocks mentioned. For errors that warrant correction please contact the editor at editorial-team@simplywallst.com.
