
 Yahoo Finance
 Toronto traffic slows drivers more than any other Canadian city, study confirms
No matter who you are or where you’re from, if you drive a car to get to work, you absolutely hate traffic. However not all commutes are one and the same. A recent study has revealed which Canadians cities have it the worst when it comes to driving.
The study, conducted by The 10 and 3, ranked the nine largest metropolitan cities in the country by population, plus five smaller cities for ‘geographic diversity.’ These 14 cities were ranked according to the estimated amount of time Google Maps suggested a commute would last, both with no traffic and during the worst possible times to be on the road. Researchers then used the help of local experts in each city to put together three different types of routes: one from each city’s major airport to its major transit hub, a second from an urban residential area to a major focal point in the downtown core, and a third route considering point-to-point routes from various other popular destinations around each city.
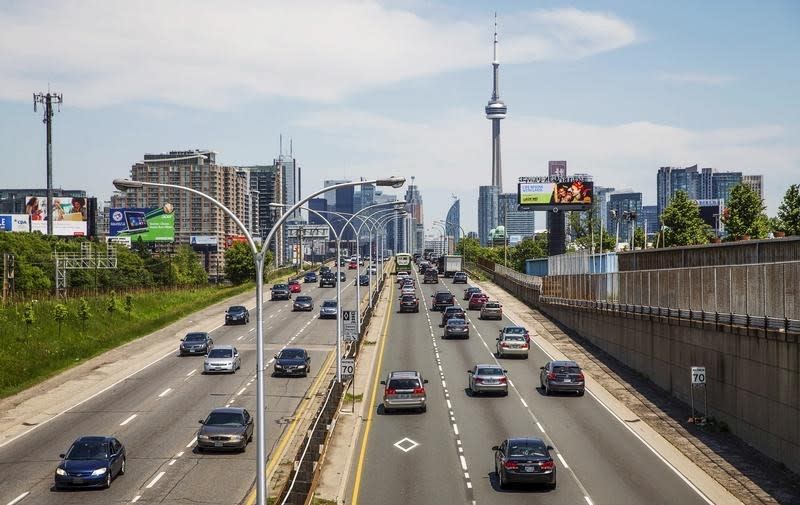
The results of the study determines that at least over the past year, Toronto is Canada’s worst nightmare for drivers. The average commute takes more almost three times longer through traffic between two major points than it does on a wide open road. The commute between Pearson Airport and Union Station is particularly dreadful. It can take well over three times as long to get from point A to point B through traffic. This is probably the kind of information that urban planners used to determine the Union-Pearson Express train service was a good idea. Of course they failed to consider that the cost of a train ticket is insanely expensive.
Most people probably aren’t surprised that Toronto ranked number one in the study, but in other studies, Montréal and Vancouver have also taken turns in the top spot. Vancouver’s large bodies of water that surround the city and the subsequent bridges create bottlenecks, and Montréal’s island Dècarie complicates things for the same reason. Smaller cities naturally fared better in the study, but there are exceptions: Calgary’s Deerfoot Trail supports more people than it was designed for and suffers from aging infrastructure, giving the city a reputation as one of the tougher places to drive through.
For those who are sick of honking horns and rising blood pressure because of time spent on the not-so-open road, there are always alternatives. You could take a bus or train to your destination in most major metropolitan areas. It may not shorten your commute, but at least you can read a book.
Here’s the ‘stretch multiplier,’ or how much additional time it takes to get somewhere in traffic compared to an open route, for each city in the study:
1. Toronto – 2.8x
2. Montreal – 2.3x
3. Vancouver – 2.0x
4. Calgary – 1.9x
5. Quebec – 1.8x (tie)
5. Ottawa – 1.8x (tie)
7. Victoria – 1.7x
8. Edmonton – 1.6x (tie)
8. Winnipeg – 1.6x (tie)
8. Halifax – 1.6x (tie)
11. Saskatoon – 1.5x (tie)
11. Regina – 1.5x (tie)
11. Hamilton – 1.5x (tie)
14. St. John’s – 1.3x
