ExGen Resources Inc. (BXXRF)
| Previous Close | 0.0446 |
| Open | 0.0424 |
| Bid | 0.0000 x 0 |
| Ask | 0.0000 x 0 |
| Day's Range | 0.0424 - 0.0424 |
| 52 Week Range | 0.0424 - 0.0786 |
| Volume | |
| Avg. Volume | 306 |
| Market Cap | 3.524M |
| Beta (5Y Monthly) | 0.71 |
| PE Ratio (TTM) | N/A |
| EPS (TTM) | -0.0000 |
| Earnings Date | N/A |
| Forward Dividend & Yield | N/A (N/A) |
| Ex-Dividend Date | N/A |
| 1y Target Est | N/A |
 GlobeNewswire
ExGen: Phoenix Raises US$80 Million for Construction of the Empire Mine, Idaho
NOT FOR DISTRIBUTION TO UNITED STATES NEWSWIRE SERVICES OR FOR DISSEMINATION IN THE UNITED STATES VANCOUVER, British Columbia, May 17, 2024 (GLOBE NEWSWIRE) -- ExGen Resources Inc. (TSX.V: EXG; OTC: BXXRF) (“ExGen”, the “Company”) is pleased to provide an update in respect of Phoenix Copper Ltd.’s (“Phoenix”) exploration and development activities at the Empire Mine Project in Custer County, Idaho, USA, further to Phoenix’s news release of May 15, 2024. ExGen owns 20% and Phoenix owns 80% of Kon
 GlobeNewswire
EXGEN: DOK Project Drill Results
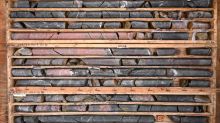
Figure 1 DK2023-03 from 229.1 to 237.7 meters yielding 8.6 meters of 0.57 Cu Eq (%). Figure 2 Plan view of chargeability merged from the 2014, 2022 and 2023 IP surveys. The merged data has not been leveled by a geophysicist and is for illustrative purposes only. Cross sections B-B’, and C-C’ in figures 3 and 4, respectively. Figure 3 Cartoon Cross Section through drill hole DK-2023-003 and chargeability. The merged data is from 3 programs, conducted in 2012, 2022 and October of 2023. It has not
 GlobeNewswire
ExGen: DOK Drilling Confirms Mineralization In Line With Golden Triangle Porphyry Copper-Gold Deposits
Table 1 Assay results for drill hole DOK2023-01 Figure 1 Cartoon Cross Section through drill holes DK-2023-001 (right) and DK-2014-001 (left) and chargeability. The merged data is from 3 programs, conducted in 2012, 2022 and October of 2023. It has not been leveled by a geophysicist and is for illustrative purposes only. Figure 2 Drill Hole Locations including 2014 and 2023 collars. Figure 3 DK-2023-001 strip log showing lithology, alteration, and assays. Figure 4 Plan view of chargeability merg