
 Yahoo Finance
 Wells Fargo & Co's Dividend Analysis
Exploring the Sustainability and Growth of Wells Fargo & Co's Dividends
Wells Fargo & Co (NYSE:WFC) recently announced a dividend of $0.35 per share, payable on 2024-06-01, with the ex-dividend date set for 2024-05-09. As investors look forward to this upcoming payment, the spotlight also shines on the company's dividend history, yield, and growth rates. Using data from GuruFocus, let's delve into Wells Fargo & Co's dividend performance and assess its sustainability.
What Does Wells Fargo & Co Do?
This Powerful Chart Made Peter Lynch 29% A Year For 13 Years
How to calculate the intrinsic value of a stock?
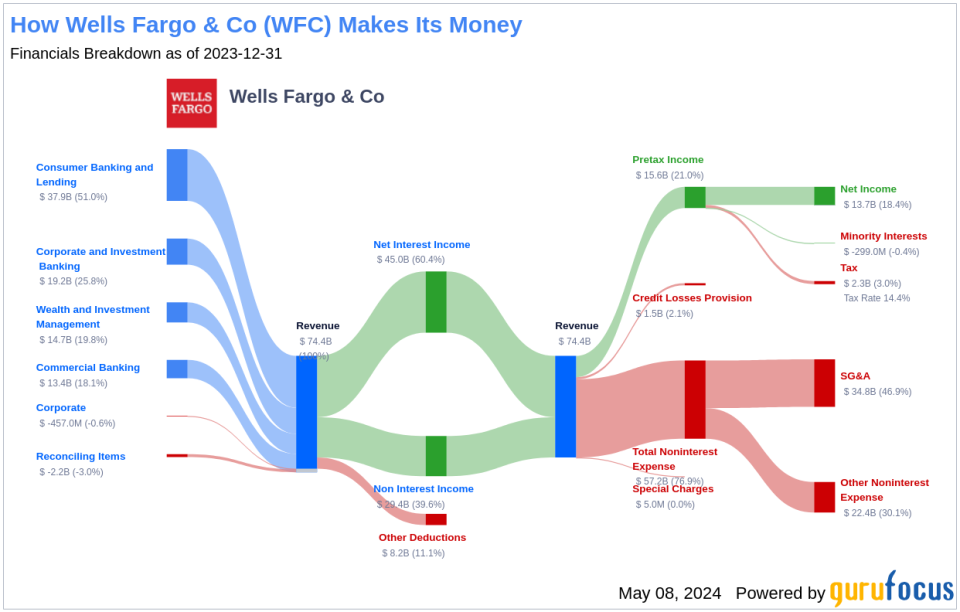
Wells Fargo & Co is one of the largest banks in the United States, boasting approximately $1.9 trillion in balance sheet assets. The company operates through four main segments: consumer banking, commercial banking, corporate and investment banking, and wealth and investment management, with a primary focus on the U.S. market.
A Glimpse at Wells Fargo & Co's Dividend History
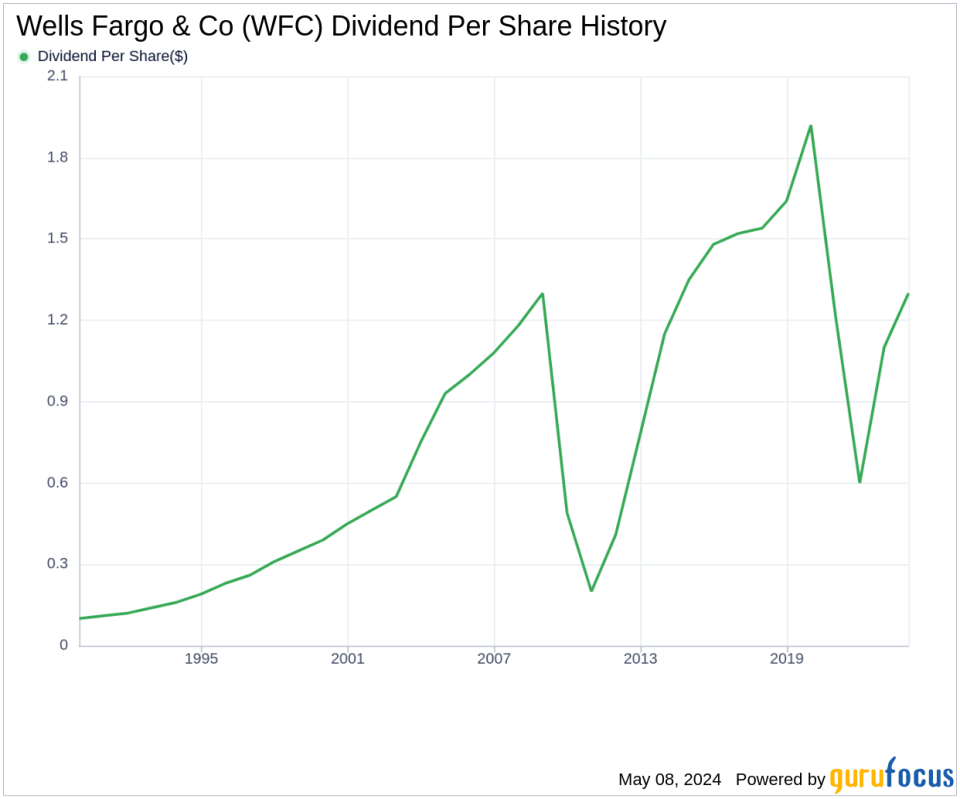
Wells Fargo & Co has maintained a consistent dividend payment record since 1986, distributing dividends on a quarterly basis. Below is a chart showing annual Dividends Per Share to track historical trends.
Breaking Down Wells Fargo & Co's Dividend Yield and Growth
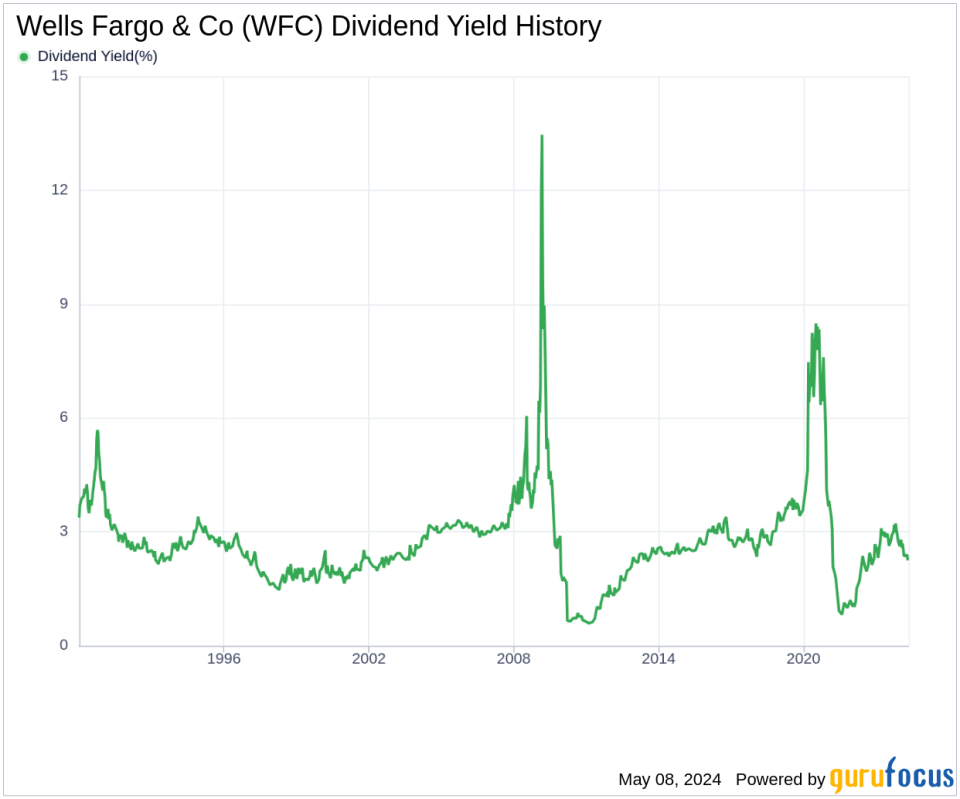
Currently, Wells Fargo & Co has a 12-month trailing dividend yield of 2.23% and a 12-month forward dividend yield of 2.32%, indicating an expected increase in dividend payments over the next year. However, the dividend growth rate presents a mixed picture: a 2.10% annual growth over the past three years, a decrease to -9.60% per year over five years, and -2.80% per year over the past decade. Today, the 5-year yield on cost for Wells Fargo & Co stock is approximately 1.35%.
The Sustainability Question: Payout Ratio and Profitability
The dividend payout ratio of Wells Fargo & Co stands at 0.28 as of 2024-03-31, suggesting that the company retains a substantial portion of its earnings for future growth and stability. The company's profitability rank is 6 out of 10, indicating fair profitability with consistent positive net income over the past decade.
Growth Metrics: The Future Outlook
Wells Fargo & Co's growth rank of 6 out of 10 suggests a fair growth outlook. The company's revenue, vital for sustaining dividends, has grown by approximately 7.30% per year on average over the past three years, outperforming about 51.67% of global competitors. Additionally, the 3-year EPS growth rate of approximately 90.80% per year and a 5-year EBITDA growth rate of 5.70% further support a robust growth trajectory.
Conclusion
Wells Fargo & Co's dividend payments, while showing signs of fluctuation, are supported by a solid payout ratio, consistent profitability, and promising growth metrics. These factors suggest a sustainable dividend policy moving forward, making it an interesting consideration for value investors. For those looking to explore further, GuruFocus Premium provides tools like the High Dividend Yield Screener to discover high-dividend yield stocks.
This article, generated by GuruFocus, is designed to provide general insights and is not tailored financial advice. Our commentary is rooted in historical data and analyst projections, utilizing an impartial methodology, and is not intended to serve as specific investment guidance. It does not formulate a recommendation to purchase or divest any stock and does not consider individual investment objectives or financial circumstances. Our objective is to deliver long-term, fundamental data-driven analysis. Be aware that our analysis might not incorporate the most recent, price-sensitive company announcements or qualitative information. GuruFocus holds no position in the stocks mentioned herein.
This article first appeared on GuruFocus.
