
 Yahoo Finance
 ITT Q1 Earnings & Revenues Beat Estimates, Increase Y/Y
ITT Inc.’s ITT first-quarter 2024 adjusted earnings of $1.42 per share surpassed the Zacks Consensus Estimate of $1.36. The bottom line jumped 21% year over year, aided by an increase in sales across each of its segments.
Total revenues of $910.6 million beat the consensus estimate of $874 million. The top line increased 14.1% year over year, buoyed by pump projects in the Industrial Process, higher friction original equipment volume in the Motion Technologies and demand strength across the Connect & Control Technologies segments. The acquisitions of Svanehøj and Micro-Mode contributed 5% to the top line.
Organic sales rose 9% year over year. Foreign currency translation had a 1% unfavorable impact on sales.
Segmental Results
Revenues from the Industrial Process segment totaled $333.9 million, up 25.3% year over year. Growth in pump projects and the buyout of Svanehøj drove the segment’s performance. Organic sales increased 12.5% and adjusted operating income grew 19.9% on a year-over-year basis.
Revenues from the Motion Technologies segment amounted to $392.4 million, implying a year-over-year increase of 7.6%. Our estimate for the same was pinned at $382 million.
Higher sales volume in friction original equipment and rail demand in KONI business aided segmental performance. Organic revenues grew 8.2%. Adjusted operating income increased 32%.
Revenues from the Connect & Control Technologies segment of $185.1 million rose 10.4% year over year on a reported basis and 7.2% organically. Our estimate was $183 million. Favorable pricing actions, volume growth in aerospace and defense components and the acquisition of Micro-Mode aided the segment’s performance. Adjusted operating income increased 14.7% year over year.
ITT Inc. Price, Consensus and EPS Surprise
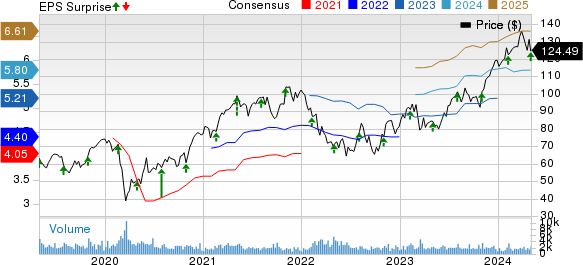
ITT Inc. price-consensus-eps-surprise-chart | ITT Inc. Quote
Margin Profile
During the quarter under review, ITT’s cost of revenues increased 13.8% year over year to $609.8 million. The gross profit jumped 14.8% to $300.8 million.
General and administrative expenses grew 4.7% year over year to $71.5 million. Sales and marketing expenses rose 16.8% year over year to $50.1 million. Research and development expenses increased 12.1% year over year to $30.0 million.
Adjusted operating income climbed 22.8% year over year to $155 million. The margin extended 120 basis points to 17%.
Balance Sheet and Cash Flow
Exiting the first quarter of 2024, ITT had cash and cash equivalents of $423 million compared with $489.2 million at the end of fourth-quarter 2023. The company’s short-term borrowings were $322.7 million compared with $187.7 million at the end of December 2023.
In the first three months of 2024, ITT generated net cash of $57.8 million from operating activities compared with $58.1 million in the year-ago quarter. Capital expenditure totaled $27.7 million in the same period, down 3.5% year over year. Free cash flow was $30.1 million in the first three months of 2024 compared with $29.4 million in the prior-year quarter.
During the first three months of 2024, ITT paid out dividends of $26.5 million, up 9.5% year over year. It did not repurchase any shares in the period compared with share repurchase of $30 million in the year-ago period.
2024 Outlook
ITT expects adjusted earnings in the range of $5.65-$5.90 per share compared with $5.45-$5.90 predicted previously. The guided range suggests an increase of 8.5-13.2% from the prior-year actuals.
Management projects revenue growth in the band of 9-12% (4-7% organically). Adjusted segment operating margin is estimated to be between 17.1% and 17.7%, higher than 16.9-17.5% estimated earlier. Free cash flow is forecast in the range of $435-$475 million. This indicates a free cash flow margin of 12-13%.
Zacks Rank & Key Picks
ITT currently carries a Zacks Rank #3 (Hold). Some better-ranked stocks are discussed below.
Carlisle Companies Incorporated CSL presently sports a Zacks Rank #1 (Strong Buy). It has a trailing four-quarter average earnings surprise of 17%. You can see the complete list of today’s Zacks #1 Rank stocks here.
The Zacks Consensus Estimate for CSL’s 2024 earnings has increased 5.8% in the past 60 days.
Ingersoll Rand plc IR currently carries a Zacks Rank of 2 (Buy). IR delivered a trailing four-quarter average earnings surprise of 15.9%.
In the past 60 days, the Zacks Consensus Estimate for Ingersoll Rand’s 2024 earnings has inched up 0.3%.
Griffon Corporation GFF presently flaunts a Zacks Rank of 1. The company delivered a trailing four-quarter average earnings surprise of 42%.
In the past 60 days, the Zacks Consensus Estimate for GFF’s 2024 earnings has decreased 1.3%.
Want the latest recommendations from Zacks Investment Research? Today, you can download 7 Best Stocks for the Next 30 Days. Click to get this free report
ITT Inc. (ITT) : Free Stock Analysis Report
Ingersoll Rand Inc. (IR) : Free Stock Analysis Report
Carlisle Companies Incorporated (CSL) : Free Stock Analysis Report
Griffon Corporation (GFF) : Free Stock Analysis Report
