
 Yahoo Finance
 Investing in Exelon (NASDAQ:EXC) five years ago would have delivered you a 26% gain
Exelon Corporation (NASDAQ:EXC) shareholders should be happy to see the share price up 11% in the last quarter. But over the last half decade, the stock has not performed well. You would have done a lot better buying an index fund, since the stock has dropped 24% in that half decade.
Now let's have a look at the company's fundamentals, and see if the long term shareholder return has matched the performance of the underlying business.
Check out our latest analysis for Exelon
To quote Buffett, 'Ships will sail around the world but the Flat Earth Society will flourish. There will continue to be wide discrepancies between price and value in the marketplace...' By comparing earnings per share (EPS) and share price changes over time, we can get a feel for how investor attitudes to a company have morphed over time.
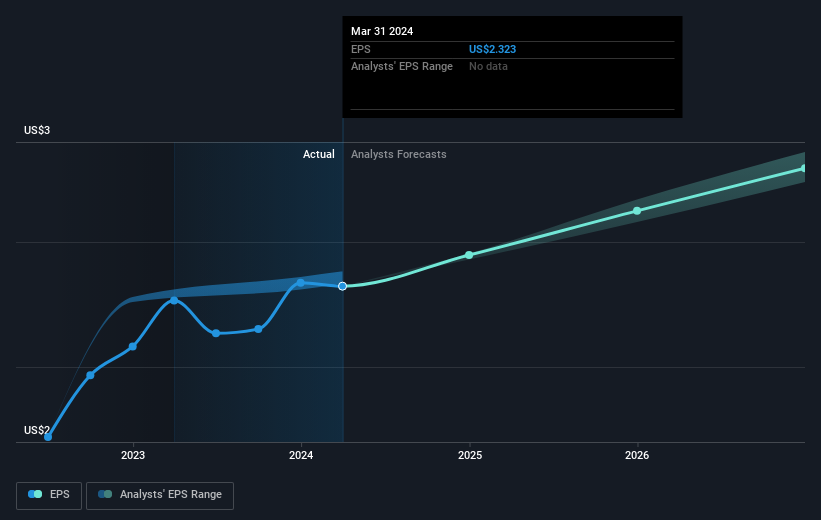
During the five years over which the share price declined, Exelon's earnings per share (EPS) dropped by 0.7% each year. This reduction in EPS is less than the 5% annual reduction in the share price. This implies that the market is more cautious about the business these days.
You can see below how EPS has changed over time (discover the exact values by clicking on the image).
Before buying or selling a stock, we always recommend a close examination of historic growth trends, available here.
What About Dividends?
It is important to consider the total shareholder return, as well as the share price return, for any given stock. Whereas the share price return only reflects the change in the share price, the TSR includes the value of dividends (assuming they were reinvested) and the benefit of any discounted capital raising or spin-off. Arguably, the TSR gives a more comprehensive picture of the return generated by a stock. We note that for Exelon the TSR over the last 5 years was 26%, which is better than the share price return mentioned above. This is largely a result of its dividend payments!
A Different Perspective
Exelon shareholders are down 9.4% for the year (even including dividends), but the market itself is up 26%. However, keep in mind that even the best stocks will sometimes underperform the market over a twelve month period. Longer term investors wouldn't be so upset, since they would have made 5%, each year, over five years. It could be that the recent sell-off is an opportunity, so it may be worth checking the fundamental data for signs of a long term growth trend. It's always interesting to track share price performance over the longer term. But to understand Exelon better, we need to consider many other factors. To that end, you should learn about the 2 warning signs we've spotted with Exelon (including 1 which can't be ignored) .
But note: Exelon may not be the best stock to buy. So take a peek at this free list of interesting companies with past earnings growth (and further growth forecast).
Please note, the market returns quoted in this article reflect the market weighted average returns of stocks that currently trade on American exchanges.
Have feedback on this article? Concerned about the content? Get in touch with us directly. Alternatively, email editorial-team (at) simplywallst.com.
This article by Simply Wall St is general in nature. We provide commentary based on historical data and analyst forecasts only using an unbiased methodology and our articles are not intended to be financial advice. It does not constitute a recommendation to buy or sell any stock, and does not take account of your objectives, or your financial situation. We aim to bring you long-term focused analysis driven by fundamental data. Note that our analysis may not factor in the latest price-sensitive company announcements or qualitative material. Simply Wall St has no position in any stocks mentioned.
