
 Yahoo Finance
 Hasbro (HAS) Stock Rises on Q1 Earnings and Revenue Beat

Hasbro, Inc. HAS reported first-quarter 2024 results, wherein earnings and revenues beat the Zacks Consensus Estimate after missing in the preceding quarter. Following the results, the stock rose 5% in the pre-market trading session on Apr 23.
Gina Goetter, chief financial officer at Hasbro, said the company’s first-quarter turnaround endeavors had seen substantial advancement. It achieved anticipated revenues and experienced notable enhancements in operating profit, primarily attributable to its operational excellence initiative and better business composition. It continues to stay aligned with its annual objectives.
Earnings & Revenues
In the first quarter of 2024, HAS reported adjusted earnings per share (EPS) of 61 cents, which beat the Zacks Consensus Estimate of 27 cents. In the year-ago quarter, it reported adjusted EPS of 1 cent.
Net revenues of $757.3 million also beat the consensus mark of $743 million. However, the top line declined 24.3% year over year from $1 billion. The decline was primarily due to eOne film and television divestiture.
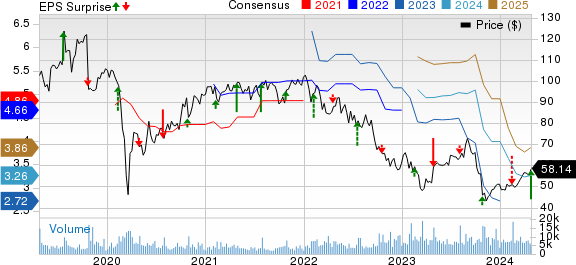
Hasbro, Inc. Price, Consensus and EPS Surprise
Hasbro, Inc. price-consensus-eps-surprise-chart | Hasbro, Inc. Quote
Brand Performances
In the quarter under discussion, Franchise Brands reported revenues of $606.5 million, down 1% year over year.
Partner Brands’ revenues plunged 34% year over year to $87.7 million from $132.7 million, mainly due to exited licenses.
Revenues at Portfolio Brands were $63.1 million, down 31% from the prior-year levels of $92.1 million.
Total gaming category revenues rose 6% year over year to $408 million.
Segmental Revenues
Hasbro has three reportable operating segments, Consumer Products, Wizards of the Coast and Digital Gaming, and Entertainment.
In the first quarter, net revenues from the Consumer Products segment decreased 20.6% year over year to $413 million primarily due to exited businesses and reduced closeout sales. Adjusted operating margin was (9.2%) against 6.8% in the year-ago quarter.
The Wizards of the Coast and Digital Gaming segment’s revenues totaled $316.3 million, up 8.2% from $339 million in the year-ago quarter. Adjusted operating margin was 38.8% compared with 26% in the year-ago quarter.
The Entertainment segment’s revenues plunged 84.9% year over year to $28 million. Adjusted operating margin was 65% against (1.3%) in the year-ago quarter.
Operating Highlights
In the first quarter, Hasbro’s cost of sales (as percentages of net revenues) was 27% compared with 28.5% in the year-earlier quarter.
Selling, distribution and administration expenses (as percentages of net revenues) reached 31% in the quarter compared with 31.7% in the year-ago quarter.
The company reported adjusted EBITDA of $172.8 million compared with $98.7 million a year ago.
Balance Sheet
As of Mar 31, 2024, cash and cash equivalents were $570.2 million compared with $386.2 million as of Apr 2, 2023. At the end of the reported quarter, inventories totaled $336.2 million compared with $713.4 million a year ago.
As of Mar 31, 2024, long-term debt was $2.97 billion, down from $3.68 billion as of Apr 2, 2023.
2024 Outlook
For 2024, segment-wise, Hasbro forecasts Consumer Products revenues to decline in the range of 7-12% at cc from the year-ago levels. This segment’s operating margin is expected to be between 4% and 6%. In the Wizards of the Coast segment, management projects revenues to decline in the 3-5% band. Operating margin is suggested to be between 38% and 40%.
In 2024, HAS expects Pro-Forma Entertainment segment revenues to decrease $15 million from a year ago. Adjusted operating margin is anticipated to be approximately 60%.
For the full year, total adjusted EBITDA is expected to be between $925 million and $1 billion.
The company currently carries a Zacks Rank #3 (Hold).
Key Picks
Some better-ranked stocks in the Zacks Consumer Discretionary sector are as follows:
Trip.com Group Limited TCOM sports a Zacks Rank #1 (Strong Buy). TCOM has a trailing four-quarter earnings surprise of 53.1%, on average. Shares of TCOM have gained 34.1% in the past year. You can see the complete list of today’s Zacks #1 Rank stocks here.
The Zacks Consensus Estimate for TCOM’s 2024 sales and EPS indicates a rise of 18.2% and 1.8%, respectively, from the year-ago levels.
JAKKS Pacific, Inc. JAKK sports a Zacks Rank #1. It has a trailing four-quarter earnings surprise of 42.6%, on average. Shares of JAKK have gained 8.3% in the past year.
The Zacks Consensus Estimate for JAKK’s 2025 sales indicates a rise of 1.9% from the year-ago levels.
Strategic Education, Inc. STRA sports a Zacks Rank #1. It has a trailing four-quarter earnings surprise of 17.2%, on average. Shares of STRA have rallied 44.1% in the past year.
The Zacks Consensus Estimate for STRA’s 2024 sales and EPS indicates a rise of 5% and 23.7%, respectively, from the year-ago levels.
Want the latest recommendations from Zacks Investment Research? Today, you can download 7 Best Stocks for the Next 30 Days. Click to get this free report
Hasbro, Inc. (HAS) : Free Stock Analysis Report
Strategic Education Inc. (STRA) : Free Stock Analysis Report
JAKKS Pacific, Inc. (JAKK) : Free Stock Analysis Report
Trip.com Group Limited Sponsored ADR (TCOM) : Free Stock Analysis Report
