
 Yahoo Finance
 Ether Bears Hit a Brick Wall as Price Collides With Bull-Market Trendline
Ether's sell-off has stalled at an upward-sloping trendline, characterizing the rally from October lows.
The immediate resistance is seen in the range of $3,180-$,3225.
Ether's {{ETH}} sell-off has stalled, with bears hitting a brick wall characterized by an upward-sloping trendline drawn off October and January lows, according to charting platform TradingView.
The bears' inability to penetrate that bull-market trendline since Monday suggests they might have to back up a bit and allow a price bounce before making another attempt at extending recent declines. The native token of the Ethereum blockchain has dropped more than 15% to $3,000 from highs near $4,100 two months ago, according to CoinDesk data. The CoinDesk 20 Index (CD20), a measure of the broader crypto market, lost 17% in the same period.
Supporting the case for an ether price bounce is the daily MACD histogram, which has flipped positive, signaling renewed bullish momentum. The MACD is widely used to gauge trend strength and changes.
Intraday momentum is steadily improving, with the widely tracked 50-hour simple moving average (SMA) again trending north, providing reassurance.
The immediate resistance is seen at the 50-day SMA near $3,180, followed by a descending trendline representing the recent correction, currently at $3,225.
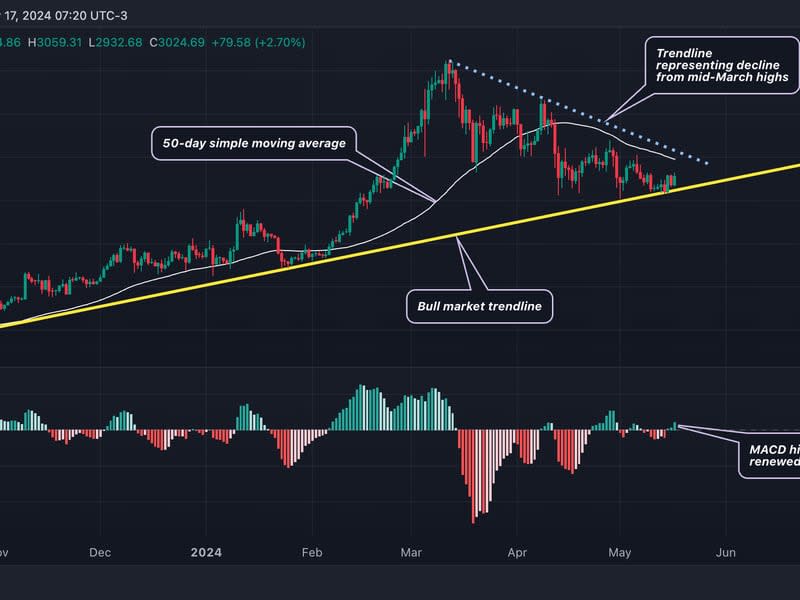
If the price drops below the bullish trendline, that would mean the broader uptrend has ended, opening the door for a more pronounced sell-off.
