
 Yahoo Finance
 A New Channel Method to Determine Key Breaks Early
DailyFX.com -
Talking Points:
-Using Trend Strength to Draw a Channel
-Where to Draw the Channel From
-Trading the Break with Managed Risk
Trendlines are a simple tool to help you see when momentum has broken. Traditionally, trendlines are drawn off price extremes to provide a key sign of a trend reversal similar to a moving average. An issue that needs to be addressed is that by the time a traditional trendline is broken, a lot of the move has already happened and you may enter on an extended. This problem of entering on an extended move leaves you at risk of entering before the market moves against you and makes it difficult to have a good risk: reward, which is critical for long-term trading success.
See also: What is the Number One Mistake Forex Traders Make?
Learn Forex: Traditional Trendline Breaks Can Occur on Extended Moves
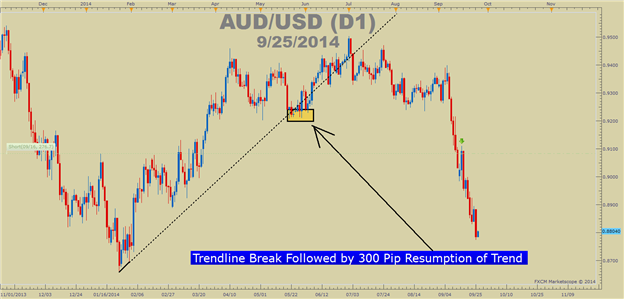
Presented by FXCM’s Marketscope Charts
Where to Draw the Channel From
This article will articulate an uncommon method for drawing a trendline based on the strength of the trend you’re looking to for a potential reversal. Instead of a taking extreme price lows in an uptrend or price highs in a downtrend and drawing a trendline by connecting those levels, we’ll cut a line down the middle. This can be done by drawing a trendline from a key low to a key high in a downtrend or a key high to a key low in a downtrend. What we’re after is the slop of the trend and use that as a component to draw a channel that can help us identify a break earlier than traditional trendlines.
Learn Forex: A Centerline is based on Extreme Lows to Extreme Highs (Opposite for Downtrend)
Presented by FXCM’s Marketscope Charts
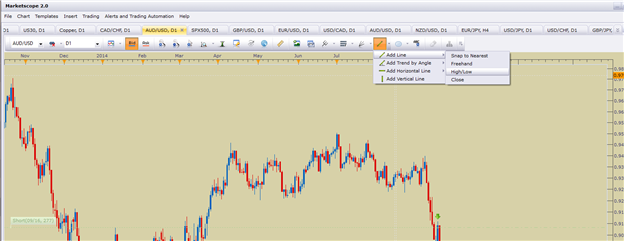
To manage the problem of entering on an extreme price, we can use the trendline tool and selecting the High/Low option. As per FXCM’s default trading platform, this option is shown above. Take an recent extreme low and trace it out to an extreme price high. From this line, you will take a copy of that line, pressing the Control button on the key board with the mouse over the line. You can then drag this line over to a corrective extreme.
Step One: Draw Trendline from Low to High

Presented by FXCM’s Marketscope Charts
Step Two: Copy That Line Toward An Extreme Corrective Low (Corrective High In A Downtrend)

Presented by FXCM’s Marketscope Charts
Step Three: Use The Break Of The Copied Line To Determine Potential Trend Reversal To Trade

Presented by FXCM’s Marketscope Charts
Trading the Break with Managed Risk
There is one question you need to ask once a potential break has been identified.
Is the market making lower highs and lower lows after breaking the copied centerline?
If the answer is yes, the channel you’ve drawn may have helped you enter on a reversal at earlier stages than a traditional trendline. From the point of the copied line break, you can look for key levels like prior support to break to confirm the trade and reduce your risk or you may use simple price action to trail your stop in the direction of your trade.
If price action reverses and you think a move lower is at hand but higher highs and higher lows start to develop, then it is best to step aside until the waters are less muddy.
See Also: How to Manage Risk with Price Action
Happy Trading!
---Written by Tyler Yell, Trading Instructor
To contact Tyler, email tyell@dailyfx.com
To be added to Tyler's e-mail distribution list, please click here
Tyler is available on Twitter @ForexYell
Become a Smarter Trader Today
Claim your FREE universal membership to DailyFX Internet Courses& save yourself hours in figuring out what FOREX trading is all about.
You'll get this FREE 20 minute “New to FX” course presented by DailyFX Education. In the course, you will learn about the basics of a FOREX transaction, what leverage is, and how to determine an appropriate amount of leverage for your trading.
DailyFX provides forex news and technical analysis on the trends that influence the global currency markets.
Learn forex trading with a free practice account and trading charts from FXCM.
