
 Yahoo Finance
 BP Reports a Disappointing Quarter
On May 7, BP PLC (NYSE:BP), a London-based company listed on the New York Stock Exchange, released its first-quarter results. Unfortunately, the results fell short of expectations, causing the stock price to decline.
The oil company reported first-quarter earnings of 80 cents per ADR share on a replacement cost basis. Earnings were down from $2.70 a year ago, which fell short of expectations.
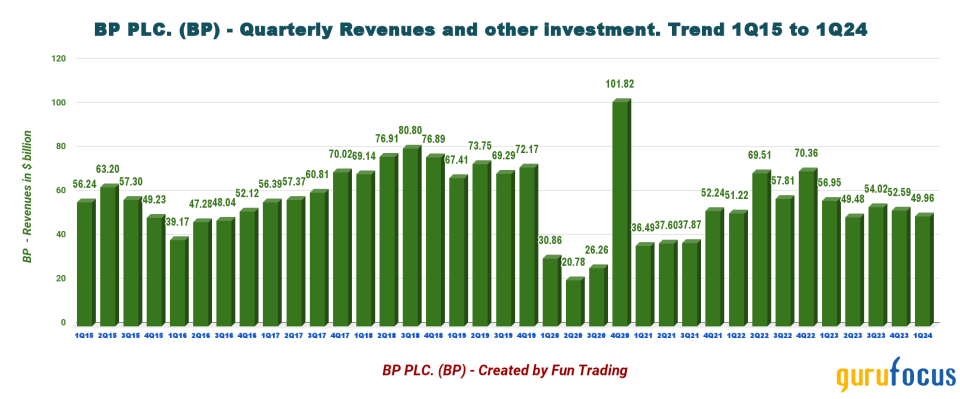
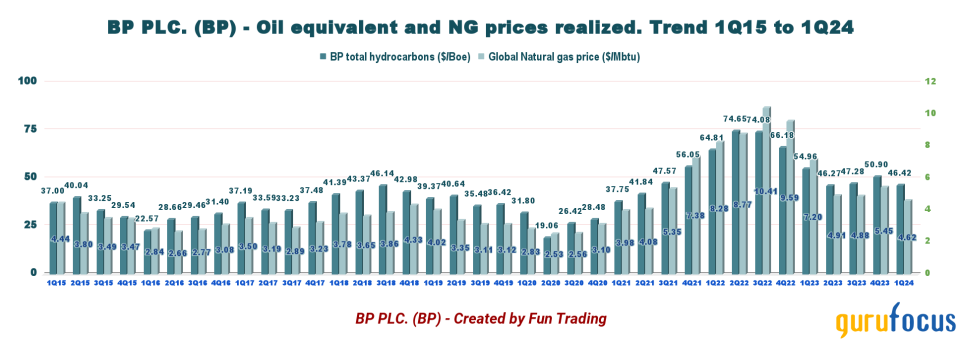
Total revenue (including other investments) was $49.96 billion, down significantly from $56.95 billion last year. The price of hydrocarbons per barrel of oil equivalent received by BP this quarter was $46.42, and the natural gas price was $4.62 per one million British thermal units.
BP's profits have gone down as a result of a combination of factors. First, lower oil and gas prices have played a part. Second, an outage at the Whiting refinery in Indiana contributed to the decline. Lastly, lower fuel margins have had a role to play.
Additionally, the earnings miss was attributed to a higher tax rate and interest expenses, which were higher than expected.
However, the company just announced a share buyback program worth $1.75 billion for the next three months and $3.50 billion for the first half of 2024. Additionally, it expects to save approximately $2 billion in cash before 2026. BP still aims to divest between $2 billion and $3 billion in 2024, totaling $25 billion from 2020 to 2025.
BP has announced a quarterly dividend of 43.62 cents per ADR share, resulting in a dividend yield of 4.61%, one of the highest among oil supermajors.
The company has also expressed its intention to expand its low-carbon business. However, its ability to achieve this goal relies on its future financial situation. Therefore, analysts pay increased attention to BP to prove that low-carbon earnings can sufficiently replace oil and gas revenue. As a reminder, the company increased low-carbon capital expenditures by 80% year over year.
The significant year-over-year drop in earnings demonstrates BP's challenge in balancing high distribution with continued investment in the business. A decision must be made between prioritizing short-term returns or ensuring a sustainable transition to a low-carbon business.
CEO Murray Auchincloss, who stepped into the role following Bernard Looney's dismissal in December, predicts 3% to 4% growth in underlying cash flow throughout the decade. However, due to the industry's volatility and unpredictability, I am skeptical about the company's long-term predictions, especially since they are often over-promising and under-delivering. Auchincloss said during the conference call:
"I'm confident in the growth on an underlying cash flow basis of 3% to 4% through the decade, including in '24 and '25. We see strong growth out-of-the upstream with new projects coming online with BPX growing, with new LNG coming online from '23 to 25 MTPA, a return to normal tar seasons in our refineries along with all the growth that we see from the TGEs and businesses like Castrol."
Investing in BP can be a good long-term strategy, but specific conditions must be met. Due to the fluctuating nature of oil prices, combining long-term investment with short-term trading strategies like LIFO or similar options is crucial. This remark can be generalized to the entire oil industry.
Long-term investors should keep accumulating this cyclical stock during periods of significant weakness. A wise allocation of about 40% to 50% of the investment for this purpose can help to minimize the risks of sudden, severe retracements, which have occurred regularly every two or three years.
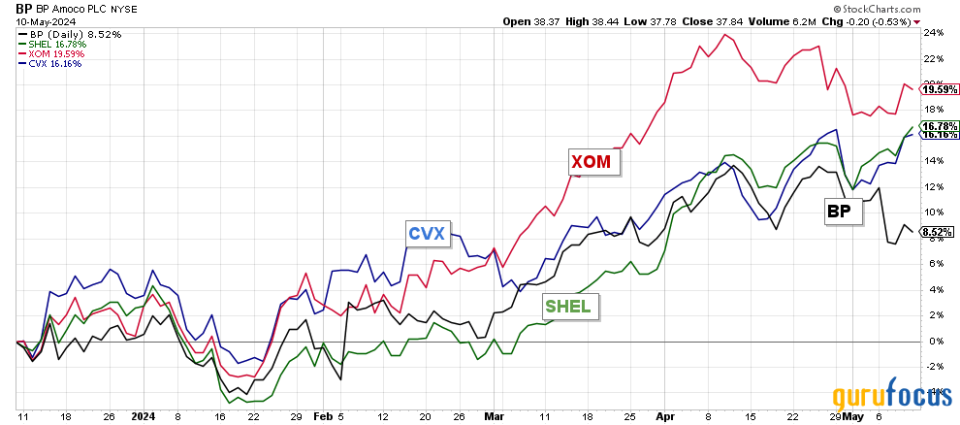
Stock's one-year performance and investment strategy
As an investor, I track a group of six major oil companies, including BP, Exxon Mobil (NYSE:XOM), Shell PLC (NYSE:SHEL), Equinor (NYSE:EQNR), TotalEnergies SE (NYSE:TTE) and Chevron (NYSE:CVX).
While I hold them as long-term investments, my stake in BP is relatively small at the moment. Over the past year, the stock has shown a modest increase of 8.50%. However, the company has underperformed most of its peers during this period, which is a factor to consider in your investment decision.
Financial table first-quarter 2024: The raw numbers
Note: Each BP ADS represents six ordinary shares. Ordinary shares are the English equivalent of common stock in a U.S. corporation.
BP | 1Q23 | 2Q23 | 3Q23 | 4Q23 | 1Q24 |
Revenues in $ Billion | 53.27 | 48.54 | 53.27 | 52.14 | 48.80 |
Total Revenues and others in $ Billion | 56.95 | 49.48 | 54.02 | 52.59 | 49.96 |
Net income in $ Billion | 4.86 | 1.79 | 4.86 | 0.37 | 2.26 |
EBITDA $ Billion | 12.57 | 8.58 | 12.57 | 5.87 | 10.06 |
EPS diluted in $/share | 1.66 | 0.60 | 1.66 | 0.13 | 0.80 |
Cash from operating activities in $ Billion | 8.75 | 6.29 | 8.75 | 9.38 | 5.01 |
Capital Expenditure Quarterly in $ Billion | 3.46 | 3.45 | 3.46 | 4.25 | 3.72 |
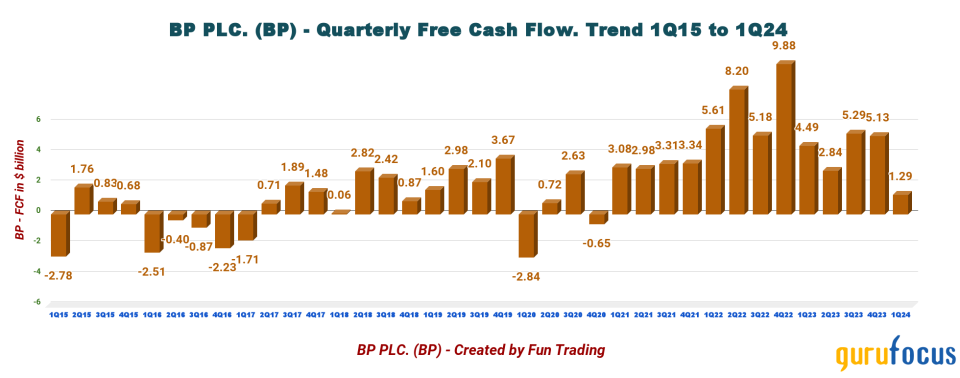
Free Cash Flow in $ Billion | 5.29 | 2.84 | 5.29 | 5.13 | 1.29 |
Total cash (+other investments) $ Billion | 30.86 | 29.59 | 30.86 | 28.59 | 32.13 |
Gross Debt in $ Billion (not including lease) | 48.81 | 49.74 | 48.81 | 51.93 | 53.01 |
Dividend per share in $ | 0.3966 | 0.4362 | 0.4362 | 0.4362 | 0.4362 |
Shares outstanding (diluted) in billions | 2.935 | 2.984 | 2.935 | 2.876 | 2.859 |
Oil Production Detail and Renewable | 1Q23 | 2Q23 | 3Q23 | 4Q23 | 1Q24 |
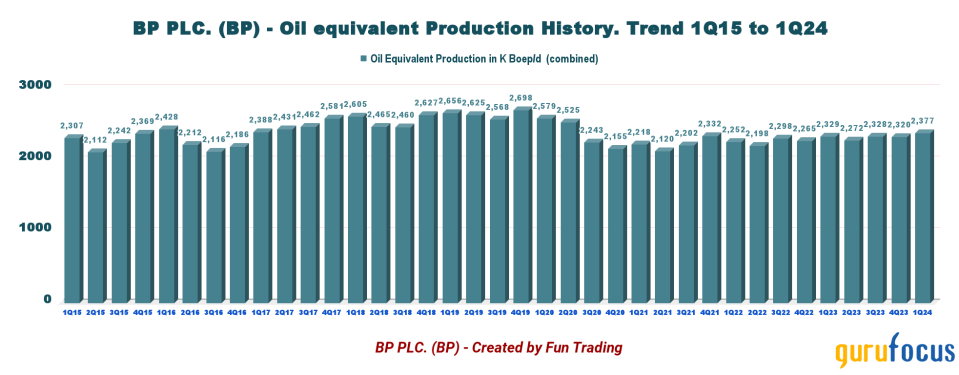
Oil Equivalent Production in K Boep/d | 2,329 | 2,272 | 2,328 | 2,320 | 2,377* |
Global liquid price ($/Boe) | 54.96 | 46.27 | 47.28 | 54.74 | 46.42 |
Global Natural gas price ($/M BTU) | 7.20 | 4.91 | 4.88 | 7.20 | 4.62 |
Source: Quarterly results
* The total equivalent production represents the gas production operations for 914,000 Boepd and oil production operations for 1,463,000 Boepd in first-quarter 2024.
Revenue, earnings details, free cash flow and upstream production
Note: The company has restated the four quarters of 2020.
BP reduced its strategic investments in the first quarter, resulting in a significant slowdown. The company generated total revenue of $49.96 billion, of which $48.8 billion came from oil sales.
Capital expenditures were $3.72 billion, a significant increase compared to the same period last year, when it was $3.13 billion. However, the income attributable to BP's shareholders was $2.26 billion, much lower than $8.22 billion in the corresponding period of the previous year.
BP's profits have declined due to lower oil and gas prices, a refinery outage and lower fuel margins. Operating cash flow in the quarter was $5.01 billion compared to $7.62 billion a year ago.
The company missed expectations, joining Exxon Mobil, while Chevron and TotalEnergies met expectations.
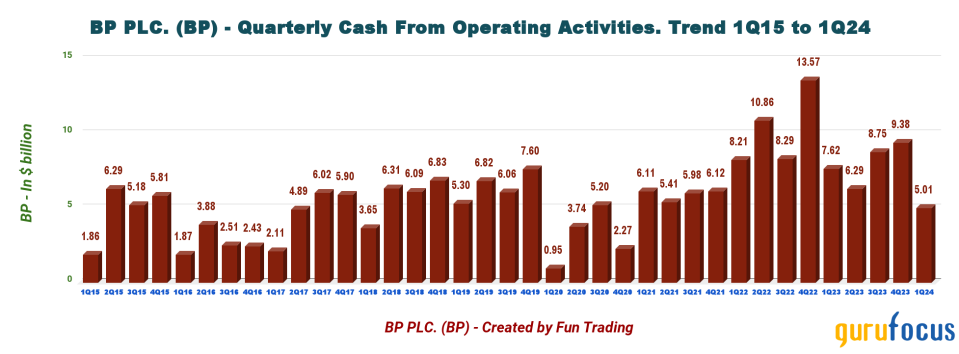
The trailing 12-month free cash flow was $14.55 billion. It came in at $1.29 billion in the first quarter. The chart above shows cash flow from operations decreased sequentially to $5.01 billion. Based on the last quarter, BP should not use cash to buy back its shares, but free cash flow seems sufficient to pay the dividend.
During the first quarter, Upstream's total production was 2,377,000 barrels of oil equivalent per day (Boepd), a 2.10% increase compared to the same period last year and a 2.40% increase sequentially. The company's oil production and operations accounted for 1,463,000 boepd, while gas and low carbon energy represented 914,000 boepd.
The company sold its hydrocarbon per barrel of oil equivalent for $46.42 this quarter, a decrease from $54.96 in the same period last year. The price of natural gas per thousand cubic feet was $4.62, compared to $7.20 in the year-ago quarter.
BP's results broken down by segment are as follows.
Profits for the gas and low-carbon energy business were $1.03 billion in the first quarter from a profit of $7.35 billion last year, mainly due to decreased liquid and gas prices year over year. Total production was 914,000 Boepd, down from 969,000 Boepd last year. Also, in this category, the company indicates the total developed renewables to FID and renewables pipeline jumped to 64.7 GW, up from 44.7 GW last year.
Oil production and operations showed total production of 1,463,000 Boepd for the first quarter was up from 1,360K Boepd in the year-ago quarter due to field start-ups in Azerbaijan and the United States. The profit before tax was $3.06 billion compared to $3.37 billion last year.
Customers and products saw underlying RC earnings before interest and taxes of $988 million, down from $2.68 billion last year. The company suffered a significant decline in refining marker margin this quarter compared to last year, from $28.1 to $20.6, or a 26.70% decline year over year. BP-operated refining availability in March was 90.40%, decreasing from 96.10% in the year-ago quarter. Total refinery throughputs were reported at 1,355,000 barrels per day, declining from 1,518,000 Boepd in the prior-year quarter.
Net debt amounted to $24.01 billion for the first quarter.
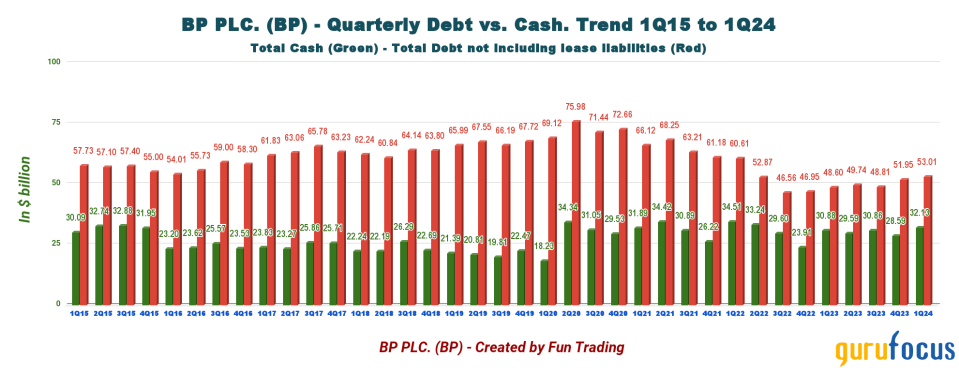
BP's net debt has increased from $21.23 billion to $24.01 billion as of the first quarter. However, the company's gearing has improved from 19.60% to 22% compared to the preceding year. It holds $32.13 billion in cash, cash equivalents and marketable securities, while its long-term debt, including current, is $53.01 billion.
The debt-to-equity ratio has increased to 0.75. As depicted in the chart above, the debt is rising again.
Technical analysis and commentary
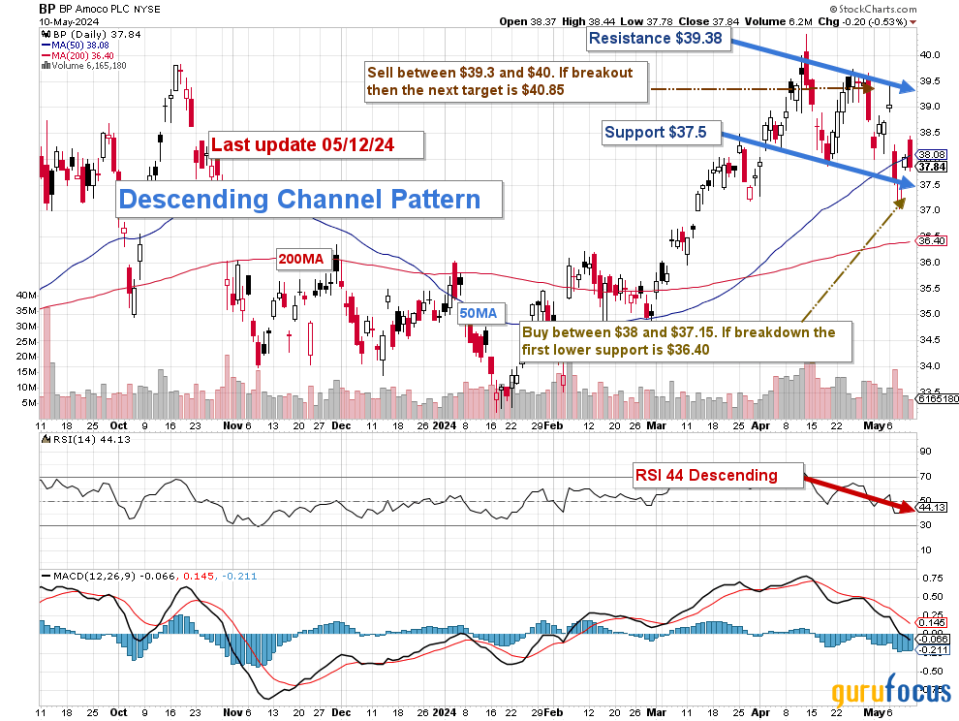
Note: The chart has been adjusted for the dividend.
BP forms a descending channel pattern with resistance at $39.38 and support at $37.50. Descending channel chart patterns indicate a downward trend in the price pattern. However, while they are short-term bearish, they often form within longer-term uptrends.
The recommended trading strategy involves selling 40% to 50% of your long position between $39.3 and $40, with possible higher resistance at $40.85. On the other hand, buying BP between $38 and $37.15 is recommended, with possible lower support at $36.40.
Warning: The TA chart must be updated weekly to be relevant.
This article first appeared on GuruFocus.
