
 Yahoo Finance
 BHP Group's (ASX:BHP) investors will be pleased with their 20% return over the last three years
Many investors define successful investing as beating the market average over the long term. But if you try your hand at stock picking, your risk returning less than the market. We regret to report that long term BHP Group Limited (ASX:BHP) shareholders have had that experience, with the share price dropping 17% in three years, versus a market return of about 21%.
It's worthwhile assessing if the company's economics have been moving in lockstep with these underwhelming shareholder returns, or if there is some disparity between the two. So let's do just that.
Check out our latest analysis for BHP Group
To quote Buffett, 'Ships will sail around the world but the Flat Earth Society will flourish. There will continue to be wide discrepancies between price and value in the marketplace...' One way to examine how market sentiment has changed over time is to look at the interaction between a company's share price and its earnings per share (EPS).
During the unfortunate three years of share price decline, BHP Group actually saw its earnings per share (EPS) improve by 1.0% per year. This is quite a puzzle, and suggests there might be something temporarily buoying the share price. Or else the company was over-hyped in the past, and so its growth has disappointed.
After considering the numbers, we'd posit that the the market had higher expectations of EPS growth, three years back. Looking to other metrics might better explain the share price change.
Given the healthiness of the dividend payments, we doubt that they've concerned the market. BHP Group has maintained its top line over three years, so we doubt that has shareholders worried. A closer look at revenue and profit trends might yield insights.
The company's revenue and earnings (over time) are depicted in the image below (click to see the exact numbers).
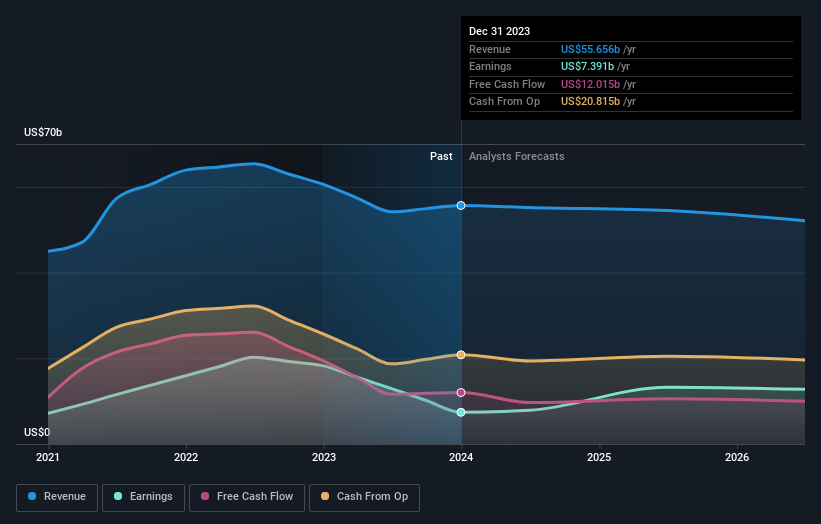
BHP Group is well known by investors, and plenty of clever analysts have tried to predict the future profit levels. You can see what analysts are predicting for BHP Group in this interactive graph of future profit estimates.
What About Dividends?
As well as measuring the share price return, investors should also consider the total shareholder return (TSR). The TSR is a return calculation that accounts for the value of cash dividends (assuming that any dividend received was reinvested) and the calculated value of any discounted capital raisings and spin-offs. It's fair to say that the TSR gives a more complete picture for stocks that pay a dividend. We note that for BHP Group the TSR over the last 3 years was 20%, which is better than the share price return mentioned above. This is largely a result of its dividend payments!
A Different Perspective
BHP Group shareholders gained a total return of 0.8% during the year. But that was short of the market average. It's probably a good sign that the company has an even better long term track record, having provided shareholders with an annual TSR of 13% over five years. It's quite possible the business continues to execute with prowess, even as the share price gains are slowing. I find it very interesting to look at share price over the long term as a proxy for business performance. But to truly gain insight, we need to consider other information, too. Consider for instance, the ever-present spectre of investment risk. We've identified 3 warning signs with BHP Group , and understanding them should be part of your investment process.
Of course BHP Group may not be the best stock to buy. So you may wish to see this free collection of growth stocks.
Please note, the market returns quoted in this article reflect the market weighted average returns of stocks that currently trade on Australian exchanges.
Have feedback on this article? Concerned about the content? Get in touch with us directly. Alternatively, email editorial-team (at) simplywallst.com.
This article by Simply Wall St is general in nature. We provide commentary based on historical data and analyst forecasts only using an unbiased methodology and our articles are not intended to be financial advice. It does not constitute a recommendation to buy or sell any stock, and does not take account of your objectives, or your financial situation. We aim to bring you long-term focused analysis driven by fundamental data. Note that our analysis may not factor in the latest price-sensitive company announcements or qualitative material. Simply Wall St has no position in any stocks mentioned.
